Scroll to:
Initiation of melting at tilt grain boundaries in austenite depending on the misorientation angle
https://doi.org/10.17073/0368-0797-2025-2-139-147
Abstract
Using molecular dynamics simulation, the authors studied the influence of misorientation angle and energy of tilt grain boundaries with the misorientation axes \(\left\langle {100} \right\rangle\), \(\left\langle {110} \right\rangle\) and \(\left\langle {111} \right\rangle\) on the melting temperature and nature of early initiation of melting at grain boundaries in austenite. It is shown that with gradual heating, melting begins from the grain boundaries, where there is a violation of the crystal structure and, accordingly, the atoms are located in less deep potential wells. In the case of large‒angle boundaries, melting begins simultaneously along the entire boundary, in the case of small-angle boundaries – in the cores of grain-boundary dislocations. Dependences of the melting temperature of the simulated calculation cells on the angle of grain misorientation and excess energy were obtained. For the misorientation axes \(\left\langle {100} \right\rangle\), \(\left\langle {110} \right\rangle\) and \(\left\langle {111} \right\rangle\), the results were similar. In the region of small misorientation angles (less than 15°), the melting point decreases almost linearly with increasing angle, then, for large-angle boundaries, the decrease becomes less intense. These dependences correlate with the energy of grain boundary formation or with the associated excess energy of the calculation cell. The main quantitative criterion determining the effect of defects on a decrease in melting temperature is excess energy, that is, the energy difference between the considered structure and the ideal crystal, which can also be interpreted as the energy of the considered structure formation. The melting point decreases linearly with increasing excess energy. Obviously, the effect of grain boundaries on the melting point becomes significant only for materials with a very high content of grain boundaries, for example, for materials with a nanocrystalline structure.
For citations:
Zorya I.V., Poletaev G.M., Bebikhov Yu.V., Semenov A.S. Initiation of melting at tilt grain boundaries in austenite depending on the misorientation angle. Izvestiya. Ferrous Metallurgy. 2025;68(2):139-147. https://doi.org/10.17073/0368-0797-2025-2-139-147
Introduction
In recent decades, considerable attention has been paid to nanocrystalline materials, which include polycrystals with an average grain size of less than 100 nm. These materials exhibit size-dependent physical and mechanical properties, primarily due to a significantly higher volume fraction of grain boundaries, triple junctions, and other defects compared to conventional coarse-grained counterparts [1 ‒ 3]. Ultrafine grain sizes are achieved using various methods, which typically include severe plastic deformation. Such materials can also be produced by sintering nanopowders, vapor-phase condensation, or other nanostructuring methods. A characteristic feature of nanocrystalline materials is their highly non-equilibrium structure, associated with a significant level of excess (or stored) energy [1 ‒ 3]. Excess energy, i.e., the difference between the free energy of the material and that of an ideal crystal at the same temperature (or, in other words, the energy that can potentially be released during structural transformations such as recrystallization), in nanocrystalline materials arises from the high density of defects: grain boundaries, triple junctions, dislocations, disclinations, and others. The specific set and types of defects largely depend on the method used to produce the nanocrystalline structure and the subsequent treatment [1 ‒ 4].
The unique properties of nanomaterials are largely determined by the high volume fraction of surface area and other interfaces (interphase or intergranular boundaries). One of these properties, which is important from both an application and manufacturing standpoint, is the dependence of melting temperature on effective size: grain size, film thickness, or nanoparticle diameter. The dependence of the melting point of nanoparticles on their size is the most thoroughly studied. It is currently well established that the melting temperature of spherical nanoparticles is inversely proportional to their diameter, a finding demonstrated both experimentally [5 – 9] and through molecular dynamics (MD) simulations [10 – 14], as well as supported by theoretical models [15 ‒ 20].
As for materials with a nanocrystalline structure, studies [21 – 25] employing MD simulations have shown that melting in such materials is not a homogeneous process: it usually starts from free surfaces and grain boundaries. A reduction in the average grain size leads to a decrease in the melting temperature of nanocrystalline silver [22; 23] and aluminum [24; 25]. Similar findings were reported in [14; 26], where nanocrystalline nickel particles exhibited a lower melting point compared to monocrystalline counterparts.
The phenomenon of melting point reduction as a function of average grain size in nanocrystalline materials, in comparison with monocrystalline nanoparticles, is more complex and less thoroughly understood. This complexity arises from the presence of not a single type of defect (such as particle surfaces), but rather a broad spectrum of grain boundaries with varying energies, along with other structural defects. This study investigates the influence of the misorientation angle and the corresponding energy of tilt grain boundaries on the melting temperature and the mechanism of melting initiation at the boundary. Tilt boundaries with misorientation axes \(\left\langle {100} \right\rangle\), \(\left\langle {110} \right\rangle\) and \(\left\langle {111} \right\rangle\) are examined. Austenite is chosen as the model material due to its widespread practical applications.
Model description
To describe interatomic interactions in the molecular dynamics model, an embedded atom method (EAM) potential was employed [27]. This potential was developed based on comparisons with experimental data and ab initio calculations of various properties of austenite. It reliably reproduces a wide range of mechanical and structural-energetic properties and has been successfully validated in simulations of various processes, including melting [27 ‒ 29].
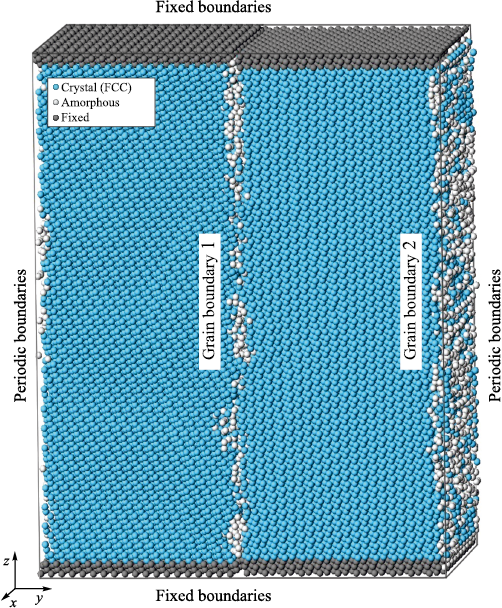
Fig. 1. Example of a calculation cell containing two tilt boundaries \(\left\langle {111} \right\rangle\) 30° |
The calculation cells had a parallelepiped shape with approximate dimensions of 9.9×10.8×13.5 nm and contained about 118,000 atoms (Fig. 1). A tilt grain boundary was introduced at the center of the calculation cell by rotating two crystals, i.e., the two halves of the cell, by a misorientation angle θ around the \(\left\langle {100} \right\rangle\), \(\left\langle {110} \right\rangle\) and \(\left\langle {111} \right\rangle\) axis, which coincided with the x-axis in Fig. 1. To keep the grain boundary positioned at the center of the calculation cell throughout the simulation, fixed boundary conditions were applied along the z-axis (at the top and bottom of the calculation cell in Fig. 1): atoms shown in dark gray remained stationary during the simulation. Periodic boundary conditions were applied along the other directions. As a result, two parallel, identical grain boundaries were present in the calculation cell. Fig. 1 shows an example of the calculation cell visualized using the Common Neighbor Analysis (CNA) method [30], highlighting the presence of two boundaries – one in the center and one at the edge of the cell – with a misorientation axis of \(\left\langle {111} \right\rangle\) and a misorientation angle of 30° (hereafter referred to as \(\left\langle {111} \right\rangle\) 30°). After the rotation of the crystals and the removal of overlapping atoms, the structure was relaxed for 20 ps at a constant temperature of 1000 K. During relaxation, atoms shifted into positions corresponding to the local energy minimum. Fig. 1 shows the calculation cell after structural relaxation.
The misorientation angle θ for the \(\left\langle {100} \right\rangle\), \(\left\langle {110} \right\rangle\) and \(\left\langle {111} \right\rangle\) grain boundaries was varied from 0° to 30°. Thus, half of the boundaries considered (up to 15°) corresponded to small-angle grain boundaries, i.e., boundaries with clearly distinguishable geometrically necessary grain-boundary dislocations, while the other half (above 15°) represented large-angle grain boundaries. As will be shown below, the main characteristic influencing the melting process is the grain boundary energy, which is typically nearly constant for large-angle boundaries. This is why, for example, most angles between boundaries at triple junctions tend to be close to 120° [31; 32]. For this reason, the misorientation angle was limited to 30° for all types of tilt boundaries considered in the present study.
The model employed an NPT ensemble in combination with a Nosé–Hoover thermostat. During melting, the specific volume increases due to the destruction of the crystal lattice; therefore, it was important to maintain constant pressure at zero. Thermal expansion with increasing temperature was taken into account, including for the fixed regions at the boundaries of the calculation cell (the dark gray regions in Fig. 1). A time integration step of 2 fs was used in the molecular dynamics simulations.
To determine the melting temperature, the gradual heating method was applied, involving the construction of dependence of the average atomic potential energy on temperature – a commonly used approach in similar studies [10 ‒ 14; 26; 33 ‒ 35]. The temperature was increased linearly at a rate of 1012 K/s by correspondingly scaling the magnitudes of atomic velocities at regular time intervals (5 ps in this case).
Results and discussion
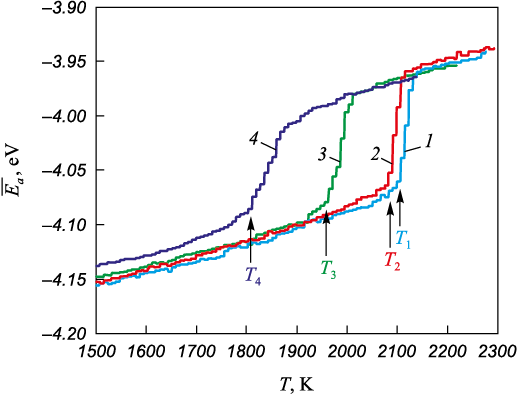
Fig. 2 shows examples of the dependencies of the average atomic potential energy on temperature for calculation cells with \(\left\langle {111} \right\rangle\) 6° (curve 3) and \(\left\langle {111} \right\rangle\) 30° (curve 4) grain boundaries, as well as for monocrystalline austenite (curves 1 and 2), during gradual heating at a rate of 1012 K/s in the range from 1500 to 2300 K. As the temperature increases, the average atomic energy within the same phase increases almost linearly due to enhanced thermal vibrations of the atoms and thermal expansion. A sharp rise in the average atomic energy on the plots corresponds to a phase transition, i.e., melting.
Fig. 2. Dependences of the average potential energy of an atom on temperature |
As previously noted, the structure in the fixed boundary regions (Fig. 1) remained crystalline even after melting, which clearly affects the melting behavior and temperature of the entire calculation cell. Nevertheless, the use of fixed boundaries was necessary to preserve the grain boundaries with the initially assigned characteristics within the cell throughout the simulation. For monocrystalline austenite, i.e., a calculation cell without any defects, an additional analysis was carried out to evaluate the influence of fixed boundaries on the melting temperature. Fig. 2 presents the temperature dependence of the average atomic energy for the monocrystal: with fixed boundaries (curve 1) and with periodic boundaries on all sides (curve 2). As can be seen, melting in the presence of fixed boundaries indeed occurred at a higher temperature compared to the case with fully periodic boundary conditions. However, this difference was minor and had little effect on the qualitative results of the study.
In the presence of grain boundaries within the calculation cell, melting proceeded heterogeneously, meaning that it was initiated at the grain boundary, after which the solid–liquid front advanced from the boundary toward the center of the grains at a finite velocity, which is known to depend on temperature. The velocity was on the order of several tens of meters per second [36; 37]. Static two-phase coexistence, i.e., the simultaneous presence of part of the calculation cell in the liquid state and another part in the crystalline state for a relatively long period, was not observed: the solid–liquid front consistently advanced in one direction or another. Therefore, the melting temperature was determined based on the onset of the phase transition (indicated by arrows in Fig. 2), which in turn was identified as the intersection point of the linear approximations before and after the start of melting.
Fig. 2 clearly shows that the calculation cell containing a large-angle \(\left\langle {111} \right\rangle\) 30° grain boundary melts at a significantly lower temperature (1835 K) than the one with the small-angle \(\left\langle {111} \right\rangle\) 6° boundary (2013 K), confirming the influence of grain boundary type on melting behavior. The grain boundary energy, and consequently the degree of disruption of the crystalline structure, is higher in the case of the large-angle boundary.
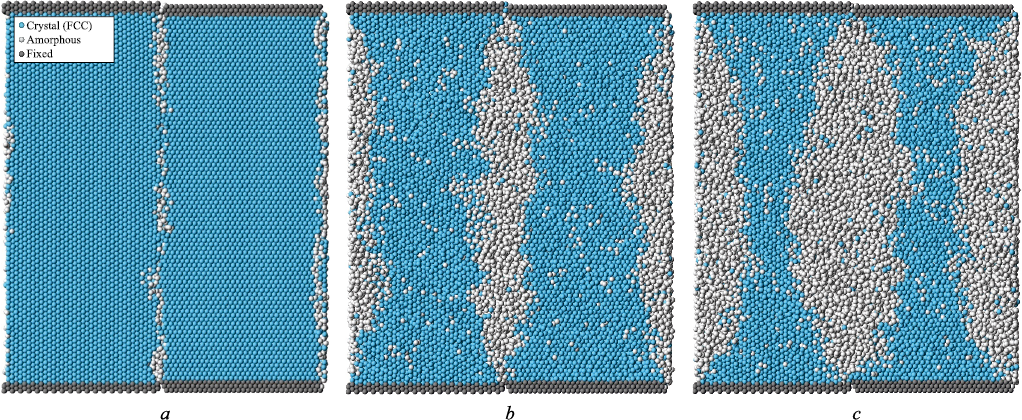
Fig. 3 shows a calculation cell in the yz-plane containing two large-angle \(\left\langle {111} \right\rangle\) 30° boundaries at different stages of melting, visualized using a structure identification tool based on the Common Neighbor Analysis (CNA) method [30]. This method allows each atom to be classified according to its local crystalline environment by analyzing the arrangement of its neighboring atoms. In the present case, an atom was considered to belong to an FCC lattice if more than 75 % of its nearest neighbors were located near the lattice sites of an ideal FCC crystal (taking into account thermal expansion), within a tolerance of 25 % of the first coordination sphere radius. Atoms that did not satisfy these conditions, or the conditions for classification as HCP, were considered to be part of an amorphous structure (shown in white in Fig. 3).
Fig. 3. Melting from large–angle grain boundaries \(\left\langle {111} \right\rangle\) 30° |
Fig. 3, a shows the relaxed initial structure of the calculation cell with two parallel \(\left\langle {111} \right\rangle\) 30° boundaries. In the case of a large-angle boundary, the defect appears almost continuous: disruption of the crystalline structure is observed along the entire boundary. As the temperature increased, melting began almost uniformly along the boundary (Fig. 3, b), except near the fixed boundaries (at the top and bottom of the calculation cell), which is expected, as the influence of the constrained crystalline structure at those boundaries becomes significant in those regions.
With further temperature increase, the solid–liquid front propagated from the grain boundaries into the bulk of the material (Fig. 3, c). The number of atoms in the amorphous phase (shown in white) increased accordingly. It can be observed that melting initiation at the boundary occurred even at a lower temperature than the melting point determined from the energy – temperature plot for the entire calculation cell (Fig. 2). This is due to the fact that the melting temperature of the entire calculation cell is influenced by the grain boundary density. A similar dependence was observed in [22 ‒ 25] as the average grain size in nanocrystalline silver or aluminum decreased, the melting temperature also decreased. In the present case, this implies that, for example, an increase in the size of the cell along the y-axis would reduce the influence of the grain boundary on the overall melting temperature.
Melting initiates at grain boundaries because the crystalline structure is more easily disrupted in their vicinity. This occurs because atoms located in defect regions are situated in shallower potential wells compared to those in a perfect crystal, and can escape more easily due to thermal vibrations. Atoms located near the solid–liquid interface on the crystalline side are also found in relatively shallow potential wells, as the atomic arrangement on the molten side is more disordered. In addition, the melt exhibits more intense self-diffusion and a greater amount of free volume compared to the crystal. These factors also contribute to easier disruption of the crystal structure near the interface than within the bulk of the crystal, and thus drive the motion of the solid–liquid front.
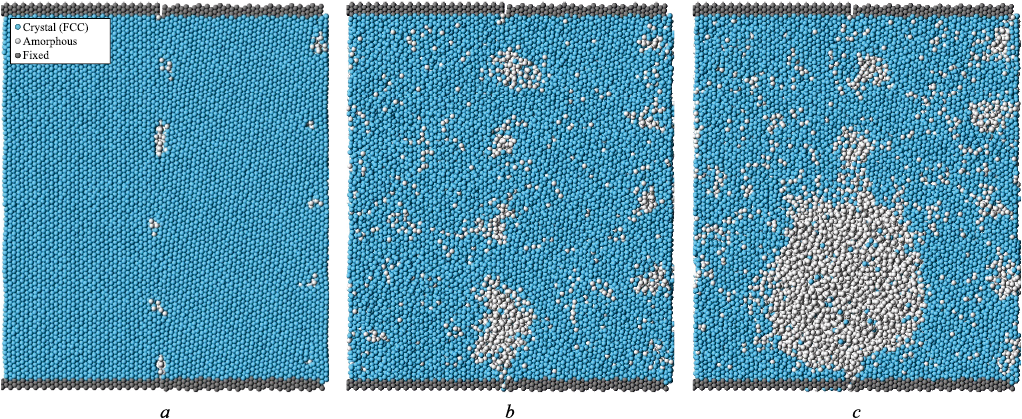
Fig. 4 shows a calculation cell containing two small-angle \(\left\langle {111} \right\rangle\) 6° grain boundaries at different time pointsduring the heating process. The structure of small-angle tilt boundaries is known to consist of an array of geometrically necessary grain-boundary dislocations, provided that no additional defects are introduced. Fig. 4, a displays the initial structure of the calculation cell, where the cores of the grain-boundary dislocations are clearly visible. These appear as small regions of disrupted crystalline order (white atoms) periodically arranged along the boundaries. For a misorientation angle of 6°, the distance between dislocations is sufficiently large, and it is clearly seen that the structure between them remains fully crystalline, with no visible disorder. Melting initiated from the dislocation cores (Fig. 4, b) as the crystalline structure began to break down. In this case, melting began at a higher temperature compared to that observed for the large-angle grain boundary. As the temperature continued to increase, some amorphous regions grew more rapidly, merged, and eventually spread throughout the entire volume.
Fig. 4. Melting from small–angle grain boundaries \(\left\langle {111} \right\rangle\) 6° |
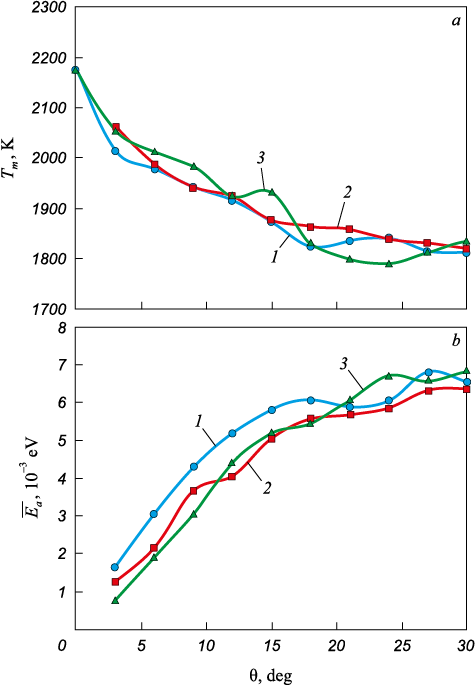
Fig. 5, a shows the dependences of the melting point Tm of the calculation cell on the misorientation angle θ for all grain boundaries considered in the study. The resulting dependences were identical for all three grain boundary misorientation axes \(\left\langle {100} \right\rangle\), \(\left\langle {110} \right\rangle\) and \(\left\langle {111} \right\rangle\). It should be noted that special misorientation angles, i.e., those characterized by a high degree of atomic coincidence between adjacent grains, were not considered in this study.
Fig. 5. Dependences of the melting point of the calculation cell Tm (а) |
As the misorientation angle θ increases in the low-angle range (less than 15°), the melting point decreases almost linearly. For large-angle grain boundaries, the decrease becomes less pronounced. The obtained Tm (θ) dependences correlate with the grain boundary energy or with the associated value of excess energy of the calculation cell. Fig. 5, b shows the dependences of the excess energy per atom Δ\(\overline {{E_a}}\), on the misorientation angle θ. This excess energy was calculated as the difference between the average potential energy per atom in a calculation cell containing a pair of the studied grain boundaries, and that in an ideal crystal containing the same number of atoms.
The obtained Δ\(\overline {{E_a}}\)(θ) dependences are typical of the angular dependences of grain boundary energy [38 – 40]. Initially, up to approximately θ = 15° (i.e., for small-angle grain boundaries), the excess energy increases almost linearly, which is due to the linear increase in the density of grain-boundary dislocations. At larger misorientation angles (above ~15°), the dislocation cores merge into a single extended defect, and the energy increases more slowly with increasing θ.
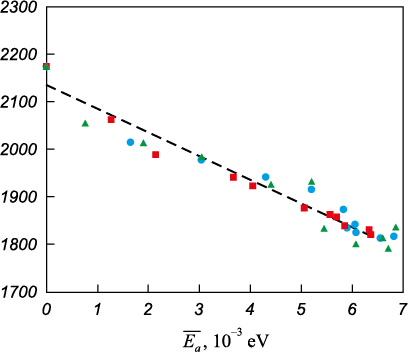
The obtained dependencies indicate a correlation between Tm and Δ\(\overline {{E_a}}\). To verify this, the Tm (Δ\(\overline {{E_a}}\)) dependence was plotted (Fig. 6). Within the studied range of Δ\(\overline {{E_a}}\), values, the relationship is approximately linear and follows the equation Tm = –49,828Δ\(\overline {{E_a}}\) + 2,135 (shown as a dashed line).
Fig. 6. Dependence of the melting point on the excess energy per atom: |
Thus, it can be concluded that the main quantitative criterion determining the influence of defects on the reduction of the melting point is the excess energy – that is, the difference between the energy of the structure under consideration and that of an ideal crystal. This quantity can also be interpreted as the formation energy of the given structure or as the energy potentially released during structural transformation, such as recrystallization. The observed linear dependence is likely due to the fact that the excess energy reflects the reduction in work required to break the crystal lattice during melting – or, put differently, the corresponding decrease in the material’s heat of fusion.
Conclusions
Molecular dynamics simulations were used to investigate the effect of the misorientation angle and grain boundary energy of tilt boundaries with misorientation axes \(\left\langle {100} \right\rangle\), \(\left\langle {110} \right\rangle\) and \(\left\langle {111} \right\rangle\) on the melting temperature and the nature of melting initiation at grain boundaries in austenite. The results show that during gradual heating, melting begins at the grain boundaries, where the crystal structure is disrupted and atoms are located in shallower potential wells. For large-angle boundaries, melting is initiated simultaneously along the entire boundary, whereas for small-angle boundaries, it starts at the cores of grain-boundary dislocations. Dependences of the melting temperature of the simulated calculation cells on the grain misorientation angle and excess energy were obtained. Similar results were observed for the \(\left\langle {100} \right\rangle\), \(\left\langle {110} \right\rangle\) and \(\left\langle {111} \right\rangle\) misorientation axes. In the range of low misorientation angles (less than 15°), the melting point decreases almost linearly as the angle increases. For large-angle boundaries, the decrease becomes less pronounced. These dependences correlate with the grain boundary energy or the corresponding excess energy of the calculation cell. The key quantitative parameter determining the influence of defects on the reduction of the melting point is the excess energy – that is, the difference between the energy of the structure under consideration and that of an ideal crystal. This value can also be interpreted as the formation energy of the given structure. A linear decrease in melting point with increasing excess energy was observed. It is clear that this effect – the influence of grain boundaries on the melting point – becomes significant only in materials with a very high content of grain boundaries, such as those with a nanocrystalline structure.
References
1. Gleiter H. Nanostructured materials: Basic concepts and microstructure. Acta Materialia. 2000;48(1):1‒29. https://doi.org/10.1016/S1359-6454(99)00285-2
2. Meyers M.A., Mishra A., Benson D.J. Mechanical properties of nanocrystalline materials. Progress in Materials Science. 2006;51(4):427–556. https://doi.org/10.1016/j.pmatsci.2005.08.003
3. Kumar K.S., Van Swygenhoven H., Suresh S. Mechanical behavior of nanocrystalline metals and alloys. Acta Materialia. 2003;51(19):5743–5774. https://doi.org/10.1016/j.actamat.2003.08.032
4. Nazarov A.A., Murzaev R.T. A method for the construction of initial structures for molecular dynamics simulations of nanocrystals with nonequilibrium grain boundaries containing extrinsic dislocations. Letters on Materials. 2018;8(1):5‒10. https://doi.org/10.22226/2410-3535-2018-1-5-10
5. Castro T., Reifenberger R., Choi E., Andres R.P. Size-dependent melting temperature of individual nanometer-sized metallic clusters. Physical Review B. 1990;42:8548‒8556. https://doi.org/10.1103/PhysRevB.42.8548
6. Dick K., Dhanasekaran T., Zhang Z., Meisel D. Size-denpendent melting of silica-encapsulated gold nanoparticles. Journal of the American Chemical Society. 2002;124(10): 2312‒2317. https://doi.org/10.1021/ja017281a
7. Hirasawa M., Orii T., Seto T. Size-dependent crystallization of Si nanoparticles. Applied Physics Letters. 2006;88(9): 093119. https://doi.org/10.1063/1.2182018
8. Tang S., Zhu S., Lu H., Meng X. Shape evolution and thermal stability of Ag nanoparticles on spherical SiO2 substrates. Journal of Solid State Chemistry. 2008;181(3):587‒592. https://doi.org/10.1016/j.jssc.2008.01.014
9. Kim H.K., Huh S.H., Park J.W., Jeong J.W., Lee G.H. The cluster size dependence of thermal stabilities of both molybdenum and tungsten nanoclusters. Chemical Physics Letters. 2002;354(1-2):165‒172. https://doi.org/10.1016/S0009-2614(02)00146-X
10. Qi Y., Cagin Т., Johnson W.L., Goddard III W.A. Melting and crystallization in Ni nanoclusters: The mesoscale regime. The Journal of Chemical Physics. 2001;115:385‒394. https://doi.org/10.1063/1.1373664
11. Shim J.-H., Lee B.-J., Cho Y.-W. Thermal stability of unsupported gold nanoparticle: A molecular dynamics study. Surface Science. 2002;512(3):262‒268. https://doi.org/10.1016/S0039-6028(02)01692-8
12. Li X. Modeling the size- and shape- dependent cohesive energy of nanomaterials and its applications in heterogeneous systems. Nanotechnology. 2014;25(18):185702. https://doi.org/10.1088/0957-4484/25/18/185702
13. Chepkasov I.V., Gafner Yu.Ya., Vysotin M.A., Redel′ L.V. A study of melting of various types of Pt-Pd nanoparticles. Physics of the Solid State. 2017;59:2076‒2081. https://doi.org/10.1134/S1063783417100109
14. Poletaev G.M., Gafner Y.Y., Gafner S.L. Molecular dynamics study of melting, crystallization and devitrification of nickel nanoparticles. Letters on Materials. 2023; 13(4):298‒303.
15. Nanda K.K., Sahu S.N., Behera S.N. Liquid-drop model for the size-dependent melting of low-dimensional systems. Physical Review A. 2002;66:013208. https://doi.org/10.1103/PhysRevA.66.013208
16. Qi W.H., Wang M.P., Zhou M., Shen X.Q., Zhang X.F. Modeling cohesive energy and melting temperature of nanocrystals. Journal of Physics and Chemistry of Solids. 2006;67(4):851‒855. https://doi.org/10.1016/j.jpcs.2005.12.003
17. Luo W., Hu W., Xiao S. Size effect on the thermodynamic properties of silver nanoparticles. The Journal of Physical Chemistry C. 2008;112(7):2359‒2369. https://doi.org/10.1021/jp0770155
18. Luo W., Deng L., Su K., Li K., Liao G., Xiao S. Gibbs free energy approach to calculate the thermodynamic properties of copper nanocrystals. Physica B: Condensed Matter. 2011;406(4):859–863. https://doi.org/10.1016/j.physb.2010.12.014
19. Li H., Han P.D., Zhang X.B., Li M. Size-dependent melting point of nanoparticles based on bond number calculation. Materials Chemistry and Physics. 2013;137(3):1007‒1011. https://doi.org/10.1016/j.matchemphys.2012.11.016
20. Zhu J., Fu Q., Xue Y., Cui Z. Accurate thermodynamic relations of the melting temperature of nanocrystals with different shapes and pure theoretical calculation. Materials Chemistry and Physics. 2017;192:22‒28. http://dx.doi.org/10.1016/j.matchemphys.2017.01.049
21. Phillpot S.R., Lutsko J.F., Wolf D., Yip S. Molecular-dynamics study of lattice-defect-nucleated melting in silicon. Physical Review B. 1989;40:2831. https://doi.org/10.1103/PhysRevB.40.2831
22. Xiao S., Hu W., Yang J. Melting behaviors of nanocrystalline Ag. The Journal of Physical Chemistry B. 2005;109(43): 20339‒20342. https://doi.org/10.1021/jp054551t
23. Xiao S., Hu W., Yang J. Melting temperature: From nanocrystalline to amorphous phase. Journal of Chemical Physics. 2006;125(18):184504. https://doi.org/10.1063/1.2371112
24. Wejrzanowski T., Lewandowska M., Sikorski K., Kurzydlowski K.J. Effect of grain size on the melting point of confined thin aluminum films. Journal of Applied Physics. 2014;116(16):164302. https://doi.org/10.1063/1.4899240
25. Noori Z., Panjepour M., Ahmadian M. Study of the effect of grain size on melting temperature of Al nanocrystals by molecular dynamics simulation. Journal of Materials Research. 2015;30:1648‒1660. https://doi.org/10.1557/jmr.2015.109
26. Poletaev G.M., Bebikhov Y.V., Semenov A.S. Molecular dynamics study of the formation of the nanocrystalline structure in nickel nanoparticles during rapid cooling from the melt. Materials Chemistry and Physics. 2023;309:128358. https://doi.org/10.1016/j.matchemphys.2023.128358
27. Lau T.T., Först C.J., Lin X., Gale J.D., Yip S., Van Vliet K.J. Many-body potential for point defect clusters in Fe–C alloys. Physical Review Letters. 2007;98:215501. https://doi.org/10.1103/PhysRevLett.98.215501
28. Oila A., Bull S.J. Atomistic simulation of Fe-C austenite. Computational Materials Science. 2009;45(2):235‒239. https://doi.org/10.1016/j.commatsci.2008.09.013
29. Zorya I.V., Poletaev G.M., Bebikhov Yu.V., Semenov A.S. Molecular dynamics study of the influence of carbon impurity on austenite nanoparticles crystallization during rapid cooling. Izvestiya. Ferrous Metallurgy. 2024;67(4):440–448. https://doi.org/10.17073/0368-0797-2024-4-440-448
30. Tsuzuki H., Branicio P.S., Rino J.P. Structural characterization of deformed crystals by analysis of common atomic neighborhood. Computer Physics Communications. 2007;177(6):518–523. https://doi.org/10.1016/j.cpc.2007.05.018
31. Fortes M.A., Deus A.M. Effects of triple grain junctions on equilibrium boundary angles and grain growth kinetics. Materials Science Forum. 2004;455-456:648−652. https://doi.org/10.4028/www.scientific.net/MSF.455-456.648
32. Perevalova O.B., Konovalova E.V., Koneva N.A., Kozlov E.V. Energy of grain boundaries of different types in fcc solid solutions, ordered alloys and intermetallics with L1(2) superstructure. Journal of Materials Science & Technology. 2003;19(6):593−596.
33. Poletaev G., Gafner Y., Gafner S., Bebikhov Y., Semenov A. Molecular dynamics study of the devitrification of amorphous copper nanoparticles in vacuum and in a silver shell. Metals. 2023;13(10):1664. https://doi.org/10.3390/met13101664
34. Poletaev G.M., Sannikov A.V., Gafner Y.Y., Gafner S.L. Molecular dynamics study of the effect of structural defects, impurities, and the presence of a shell on the melting temperature of metallic nanoparticles. Letters on Materials. 2024;14(4):332‒339. https://doi.org/10.48612/letters/2024-4-332-339
35. Poletaev G.M., Bebikhov Yu.V., Semenov A.S., Sitnikov A.A. Molecular dynamics investigation of the effect of the interface orientation on the intensity of titanium dissolution in crystalline and amorphous aluminum. Journal of Experimental and Theoretical Physics. 2023;136(4):477‒483. https://doi.org/10.1134/S1063776123040118
36. Chan W.-L., Averback R.S., Cahill D.G., Ashkenazy Y. Solidification velocities in deeply undercooled silver. Physical Review Letters. 2009;102:095701. https://doi.org/10.1103/PhysRevLett.102.095701
37. Zhang H.Y., Liu F., Yang Y., Sun D.Y. The molecular dynamics study of vacancy formation during solidification of pure metals. Scientific Reports. 2017;7:10241. https://doi.org/10.1038/s41598-017-10662-x
38. Li S., Yang L., Lai C. Atomistic simulations of energies for arbitrary grain boundaries. Part I: Model and validation. Computational Materials Science. 2019;161:330‒338. https://doi.org/10.1016/j.commatsci.2019.02.003
39. Olmsted D.L., Foiles S.M., Holm E.A. Survey of computed grain boundary properties in face-centered cubic metals: I. Grain boundary energy. Acta Materialia. 2009; 57(13):3694‒3703. https://doi.org/10.1016/j.actamat.2009.04.007
40. Van Beers P.R.M., Kouznetsova V.G., Geers M.G.D., Tschopp M.A., McDowell D.L. A multiscale model of grain boundary structure and energy: From atomistics to a continuum description. Acta Materialia. 2015;82:513‒529. https://doi.org/10.1016/j.actamat.2014.08.045
About the Authors
I. V. ZoryaRussian Federation
Irina V. Zorya, Dr. Sci. (Phys.-Math.), Prof., Head of the Chair of Heat-Gas-Water Supply, Water Disposal and Ventilation
42 Kirova Str., Novokuznetsk, Kemerovo Region – Kuzbass 654007, Russian Federation
G. M. Poletaev
Russian Federation
Gennadii M. Poletaev, Dr. Sci. (Phys.-Math.), Prof., Leading Researcher
46 Lenina Ave., Barnaul, Altai Territory 656038, Russian Federation
Yu. V. Bebikhov
Russian Federation
Yurii V. Bebikhov, Dr. Sci. (Phys.-Math.), Assist. Prof.
5 Tikhonova Str., Mirnyi, Republic of Sakha (Yakutia) 678170, Russian Federation
A. S. Semenov
Russian Federation
Aleksandr S. Semenov, Dr. Sci. (Phys.-Math.), Director of the Institute
5 Tikhonova Str., Mirnyi, Republic of Sakha (Yakutia) 678170, Russian Federation
Review
For citations:
Zorya I.V., Poletaev G.M., Bebikhov Yu.V., Semenov A.S. Initiation of melting at tilt grain boundaries in austenite depending on the misorientation angle. Izvestiya. Ferrous Metallurgy. 2025;68(2):139-147. https://doi.org/10.17073/0368-0797-2025-2-139-147


