Scroll to:
A method for studying the frequency stability of materials during tests for multi-cycle fatigue of steel
https://doi.org/10.17073/0368-0797-2023-3-367-375
Abstract
For trouble-free operation without loss of elastic and inelastic properties of particularly critical elements of electrical-to-mechanical vibration converters during a long period of cyclic operation, it is necessary, in addition to studying the fatigue characteristics of materials used for their manufacture, to study these alloys for frequency stability, since minor deviations in the frequency of natural oscillations lead to unacceptable errors in the operation of such high-precision products. To carry out such studies, we developed and constructed an original installation, in which sinusoidal loading is carried out according to the “soft” scheme of flat samples cantilever bending operating in self-oscillation mode. The frequency of cyclic loading in this installation is generated by current pulses, which are a response to the frequency of the test sample natural oscillations converted using electronics. As a result, frequency equality is achieved in the test process. An algorithm for calculating stresses depending on the loading amplitude of steel samples of different geometric shapes was developed. It is shown that the stress on the sample calculated by the deformation amplitude in all cases is 8 – 10 % higher than the stress calculated by the force, regardless of the shape of the proposed samples. To verify the proposed research method, martensitic-aging steel was tested at loads close to the fatigue limit, since frequency stability in this range is of great interest. We obtained the frequency characteristics in the multi-cycle test area. It was determined that with an operating time of 50 million loading cycles, the frequency change was 0.75 Hz. The dynamics of frequency stability was revealed: the frequency changed most intensively during the first 10 million loading cycles, during this time the frequency changed by 0.54 Hz.
Keywords
For citations:
Myl’nikov V.V., Dmitriev E.A. A method for studying the frequency stability of materials during tests for multi-cycle fatigue of steel. Izvestiya. Ferrous Metallurgy. 2023;66(3):367-375. https://doi.org/10.17073/0368-0797-2023-3-367-375
Introduction
Standard fatigue tests serve the purpose of determining the mechanical properties of a material [1]. Engineers rely on these test results for material selection and structural analysis [2].
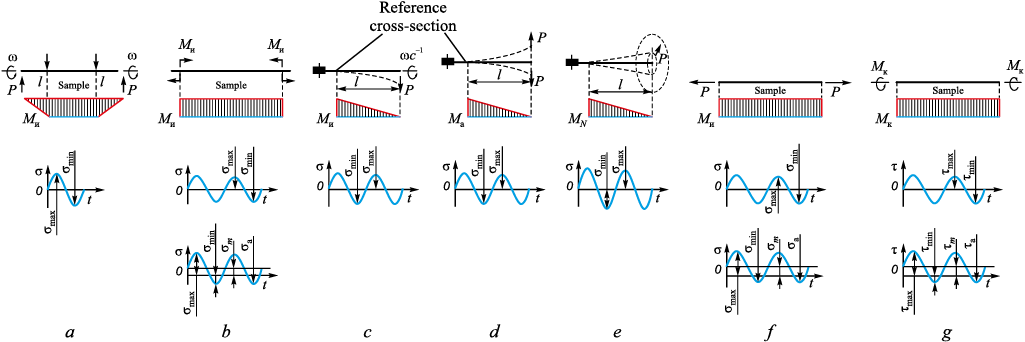
Several cyclic test procedures exist [3 – 6]. The essential fatigue test properties to accurately simulate the part’s operating stress and strain [7 – 10] are as follows:
–loading program determined by the cycle amplitude form (Fig. 1);
– load scheme (Fig. 2);
– testing to a specified stress (σ, MPa) (Fig. 2, a) or strain (ε, mm) (Fig. 2, d).
Fig. 1. Varieties of cycle amplitude forms:
Fig. 2. Loading schemes during fatigue tests: |
Mission-critical components undergo validation using dedicated testing machines and specialized testing procedures. For example, materials with low inelastic properties are required to make parts exposed to complex cyclic loading and dimensionally stable components. The inelastic properties exhibited during cyclic loading can be described as “internal friction”, “imperfect elasticity”, “damping", “mechanical hysteresis”, or “energy dissipation” [11]. It is commonly assumed in most studies that microplastic deformations under cyclic loading are localized and unevenly distributed due to the heterogeneity of the material‘s micro-properties. Another test involves measuring the mechanical properties at different temperatures to determine the elastic limit and activation energy of the micro deformations [12 – 15].
The objective of this study is to develop a testing procedure for estimating the frequency stability in elastic elements used in high-precision oscillators that convert electrical vibrations into mechanical oscillations. Even slight changes in frequency of natural oscillations (eigenfrequencies) caused by variations in the elastic modulus, material inelasticity, and of atomic and lattices vibrations can result in unacceptable errors in electric-to-mechanical oscillation conversion and premature fatigue failure [16 – 19].
Materials and Methods
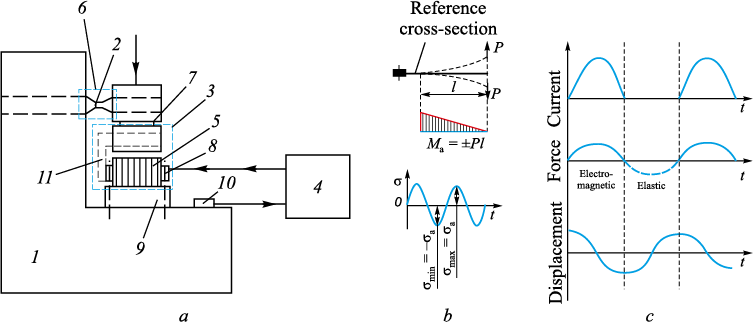
A frequency stability testing installation was developed as shown in Fig. 3, designed specifically for conducting tests under unique stress conditions. This testing apparatus involved the application of isothermal cyclic loading to a flat cantilever sample, referred to as the “soft test” [20]. It employed an electromechanical oscillator with mechanical vibration frequency precisely aligned to the sample’s eigenfrequency, facilitating resonance oscillations.
Fig. 3. Diagrams: |
The installation comprised three distinct components arranged separately:
– bed: this component supported both the sample and the electromagnetic exciter;
– power supply and automation unit: responsible for powering the electromagnetic exciter coil, this unit adjusted the amperage and frequency as needed;
– measurement system for monitoring oscillatory parameters.
The bed, a robust L-shaped metal structure, was installed on vibration isolators. It facilitated the transfer of sample oscillations to the piezoelectric accelerometer. The operation of the installation proceeded as follows: the sensor’s signal was transmitted to the power supply and automation unit, which then supplied the electromagnetic exciter coil with a frequency matching the sample’s eigenfrequency. To prevent the overlap of vibrational waves and enhance oscillation transfer, the bed and the coil (assembled with the stator at one end of the electromagnetic exciter armature) were isolated from each other using vibration isolators (antivibration pads).
The electromagnetic exciter coil is energized by current pulses supplied from the power supply (Fig. 3, a). These pulses induce an electromagnetic force that causes the armature, along with the sample, to move downward. the When the current is interrupted, the elastic force reinstates the sample to its original position, subjecting it to cyclic loading. The displacement curve of the sample’s end is illustrated in Fig. 3, c. As fatigue advances, the eigenfrequency of the sample undergoes changes, consequently modifying the frequency of cyclic loading.
Through a series of comprehensive tests, we estimated the fatigue properties, frequency characteristics under cyclic loading, and determined the endurance limit. The frequency characteristics also serve as an indicator of the sample’s rate of damage and enables estimation of its remaining lifespan [21].
The following variables were measured in our experiments:
– frequency;
– number of load cycles;
– amplitude of oscillations (measured through an optical sensor);
– amplitude of oscillations (measured via a photoelectric sensor);
– amplitude of oscillations (measured using a piezoelectric accelerometer);
– average current within the exciter coil circuit;
– the waveforms were visualized using an oscilloscope.
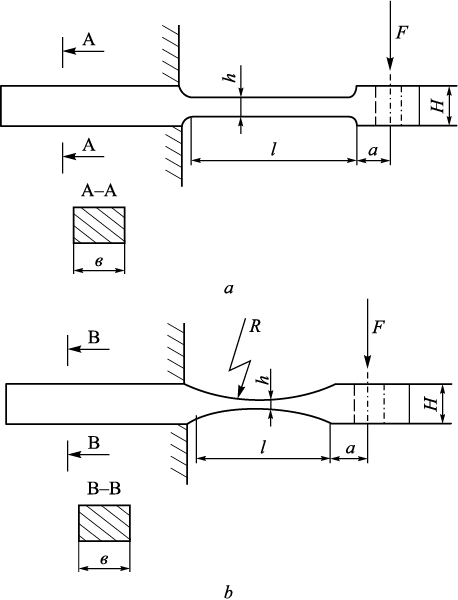
The samples illustrated in Fig. 4 were composed of the 03N18K9M5T-EL steel grade. The corresponding Table presents the dimensions of the samples.
Fig. 4. Sketches of the samples:
Dimensions of fatigue test samples, mm
|
We derived the stress within the sample’s cross-section from the amplitude of oscillations. In order to gauge the stress, we established a correlation between the force applied to the sample and the displacement of the sample at the point of force application. Subsequently, the stress was calculated based on the force value. We also deduced the analytical relationship between force and displacement for the steady mode. It is assumed that during oscillations, the forces applied to the sample (external force, inertia, elastic force) generate the same maximum stress and maximum displacement (vibration amplitude) as the static force equivalent to the resultant dynamic force.
For the curved axis of a variable cross-section beam, we employed an approximate differential equation:
| \[EJ(x)\frac{{{d^2}y}}{{d{x^2}}} = M(x),\] | (1) |
where J(x) represents the second area moment; E stands for Young’s modulus; M(x) denotes the bending moment; y is the coordinate in the force direction; x is the coordinate along the beam axis.
Stress vs. Vibration Amplitude in Flat Samples
The eference point is located at the sample’s restraint point. The bending moment at a distance x from the restraint point is givem by:
| M = F(l + a – x). | (2) |
The displacement of the sample segment with a height h: \(\frac{{{d^2}y}}{{d{x^2}}} = \frac{{F(l + a - x)}}{{E{J_1}}},\) where \({J_1} = \frac{{b{h^3}}}{{12}}\).
Initial conditions are: x = 0; y1 = 0; \(\frac{{d{y_1}}}{{dx}} = 0\).
A solution for the specified initial conditions is:
| \[\left\{ \begin{array}{l}\frac{{d{y_1}}}{{dx}} = \frac{F}{{E{J_1}}}x\left( {l + a - \frac{x}{2}} \right);\\{y_1} = \frac{F}{{E{J_1}}}\frac{{{x^2}}}{2}\left( {l + a - \frac{x}{3}} \right).\end{array} \right.\] | (3) |
An equation for the displacement of the sample segment with height H: \(\frac{{{d^2}{y_2}}}{{d{x^2}}} = \frac{{F(l + a - x)}}{{E{J_2}}},\) where \({J_2} = \frac{{b{H^3}}}{{12}}\).
The solution is:
| \[\left\{ \begin{array}{l}\frac{{d{y_2}}}{{dx}} = \frac{F}{{E{J_2}}}x\left( {l + a - \frac{x}{2}} \right) + {C_1};\\{Y_2} = \frac{F}{{E{J_2}}}\frac{{{x^3}}}{2}\left( {l + a - \frac{x}{3}} \right) + {C_1}X + {C_2}.\end{array} \right.\] | (4) |
Initial conditions are: x = l; \(\frac{{d{y_1}}}{{dx}} = \frac{{d{y_2}}}{{dx}};{\rm{ }}{y_1} = {y_2}\).
By substituting the values of x = l into (3) and (4), and solving the equations, we obtain:
\[{C_1} = \frac{F}{E}l\left( {\frac{l}{2} + a} \right)\left( {\frac{1}{{{J_1}}} - \frac{1}{{{J_2}}}} \right);{\rm{ }}{C_2} = \frac{F}{E}\frac{{{l^2}}}{2}\left( {\frac{l}{3} + a} \right)\left( {\frac{1}{{{J_1}}} - \frac{1}{{{J_2}}}} \right).\]
Using the constants the C1 and C2 , along with the equation for y2 derived from (4), we are able to determine the maximum displacement at the point of force application for x = l + a:
\[\begin{array}{c}{A_m} = \frac{F}{{E{J_2}}}\frac{{{{(l + a)}^3}}}{3} + \frac{F}{E}l(l + a)\left( {\frac{l}{a} + a} \right)\left( {\frac{1}{{{J_1}}} - \frac{1}{{{J_2}}}} \right) - \\ - \frac{F}{E}\frac{{{l^2}}}{2}\left( {\frac{l}{3} + a} \right)\left( {\frac{1}{{{J_1}}} - \frac{1}{{{J_2}}}} \right).\end{array}\]
Given the provided values of h and H where J2\( \gg \)J1 (J1 = 208.3 mm4; J2 = 3662 mm4), taking into account this inequality and disregarding the inherent bending of the heightened sample segment with heigh H, we arrive at a more straightforward expression:
| \[{A_m} = \frac{{Fl}}{{E{J_1}}}\left( {{a^2} + la + \frac{{{l^2}}}{3}} \right).\] | (5) |
The stress at the reference cross-section (the restraint point) is: \[\sigma = \frac{{F(l + a)}}{W}\].
By expressing F from (5) and taking into account that \[\frac{{{J_1}}}{W} = \frac{h}{2}\], we obtain the final expression:
| \[\sigma = \frac{{1.5h(l + a)}}{{l\left( {3{a^2} + 3la + {e^2}} \right)}}E{A_m}.\] | (6) |
For the sample dimensions indicated in Fig. 4, a, we get: σ = 26.9·10\(^ - \)5EAm.
For the average Young’s modulus E = 2·105 MPa: σ = 53.8Am, where σ is measured in, Am in mm.
Stress vs. Vibration Amplitude in Corset Samples
We approached the analysis of displacements separately for the curved and thickened segments.
To estimate the displacement of the curved segment, we positioned the origin in the midpoint of this segment (at l/2 from the restraint point). Consequently, the height of the cross-section at a distance x from the origin is given by:
| \[h(x) = h + \left( {R - \sqrt {{R^2} - {x^2}} } \right).\] | (7) |
The bending moment at x is: \(M(x) = F\left( {\frac{l}{2} + a - x} \right)\).
The equation for the displacement is derived from equation (1) by substituting \({J_1} = \frac{{b{h^3}(x)}}{{12}}\). This is further supplemented by h(x) from equation (7).
The resultant equation is:
| \[\frac{{{d^2}{y_1}}}{{d{x^2}}} = \frac{{1.5F}}{{bE}}\frac{{0.5l + a - x}}{{{{\left( {0.5h + R - \sqrt {{R^2} - {x^2}} } \right)}^3}}}.\] | (8) |
The value of x is in the range: \( - \frac{l}{2} \le x \le {l_2}\).
A computer-generated solution of differential equation (8) for x = 0,5l: produces the displacement y1m , and angle \({\theta _{1m}} = \frac{{d{y_1}}}{{dx}}\).
For the estimation of the displacement of the thickened segment, we positioned the origin at a distance l from the sample’s restraint point.
The equation describing the displacement of this segment is: \(\frac{{{d^2}{y_2}}}{{d{x^2}}} = \frac{{F(a - x)}}{{E{J_2}}}\), where \({J_2} = \frac{{b{H^3}}}{{12}}\).
The solution for this equation is:
| \[\left. \begin{array}{r}\frac{{d{y_2}}}{{dx}} = \frac{F}{{E{J_2}}}x\left( {a - \frac{x}{2}} \right) + {C_1};\\{y_2} = \frac{F}{{E{J_2}}}\frac{{{x^2}}}{2}\left( {a - \frac{x}{3}} \right) + {C_1}x + {C_2},\end{array} \right\}\] | (9) |
where 0 ≤ x ≤ a.
Initial conditions are: x = 0; \({\theta _{1m}} = \frac{{d{y_2}}}{{dx}}\); y2 = y1m .
Resulting in C1 = θ1m ; C2 = y1m .
By substituting x = a into (9), we find y2 at the point of force application, which is the amplitude of oscillations: \({A_m} = \frac{F}{{E{J_2}}}\frac{{{a^3}}}{2} + {\theta _{1m}}a + {y_{1m}}\).
Due to the substantial value of J2 , the first term of this expression is significantly smaller compared to the other two and can be disregarded.
Let us denote \({\theta '_{1m}}\) and \({Y'_{1m}}\) the values derived from equation (9) for \(\frac{{1.5F}}{{bE}} = 1\).
Then \({\theta _{1m}} = {\theta '_{1m}}\frac{{1.5F}}{{bE}};{\rm{ }}{y_{1m}} = {y'_{1m}}\frac{{1.5F}}{{bE}}\).
The amplitude of oscillations is:
| \[{A_m} = \frac{{1.5F}}{{bE}}\left( {{{\theta '}_{1m}}a + {{y'}_{1m}}} \right).\] | (10) |
The stress in the sample cross-section at the center of the curved segment: \(\sigma = \frac{{F(0.5l + a)}}{W}\).
By expressing F from equation (10) and considering \(W = \frac{{b{h^2}}}{6}\), we arrive the final expression:
| \[\sigma = \frac{{2(l + 2a)}}{{{h^2}\left( {{{\theta '}_{1m}}a + {{y'}_{1m}}} \right)}}E{A_m}.\] | (11) |
The problem was addressed through numerical solutions. Computer calculations for the b1 and b2 samples (with dimensions provided in the table and Fig. 4) yielded:
– sample b1: \({\theta '_{1m}}\) = 59.84; \({y'_{1m}}\) = 1853.2;
– sample b2: \({\theta '_{1m}}\) = 84.1; \({y'_{1m}}\) = 2532.4.
From equation (11), we obtain:
– sample (b1): σ = 24.75·10\(^ - \)3EAm, MPa;
– sample (b2): σ = 18.3·10\(^ - \)3EAm, MPa.
Considering the average Young’s modulus E = 2·105 MPa:
– σ = 49.5Am for sample b1;
– σ = 36.6Am for sample b2.
Here, σ is measured in MPa and Am in mm.
Error Estimation of the Stress Value in the Reference Cross-Section
If direct measurement errors for variations in Young’s modulus and the geometric dimensions of the sample are available, we can estimate the error of the indirectly measured σ as stated in equation (6)
| \[\frac{{\Delta \sigma }}{\sigma } = {\delta _A} + {\delta _E} + {\delta _e},\] | (12) |
where \({\delta _E} = \frac{{\Delta E}}{E}\) is the relative error of Young’s modulus; \({\delta _A} = \frac{{\Delta A}}{A}\) is the relative error of the amplitude;
| \[{\delta _e} = \frac{{\Delta h}}{h} + \left[ {\frac{1}{{a + l}} + \frac{1}{l} + \frac{{2l + 3a}}{{3\left( {{a^2} + ab + \frac{{{l^2}}}{3}} \right)}}} \right]\Delta l + \left( {\frac{1}{{a + l}} + \frac{{l + 2a}}{{{a^2} + al + \frac{{{l^2}}}{3}}}} \right)\Delta a - \] | (13) |
is the relative error of the sample’s dimensions.
The relative error of the amplitude of oscillations has been previously determined as: δA = 0.01 (1 %).
The relative error of the sample’s linear dimensions is estimated as (13):
| δe = 0.0123 (1.23 %). | (14) |
There is inherent uncertainty in the value of Young’s modulus. Available sources specify that for high elastic steels, this value varies from 1.9∙105 to 2.1∙105 MPa. In this context ΔE = ±104 MPa should be considered as the error in Young’s modulus:
| δE = 0.05 (5 %). | (15) |
The total error of the estimated stress in the reference section is given by:
| \(\frac{{\Delta \sigma }}{\sigma }\) = 0.0723 (7.23 %). | (16) |
For validation purposes, we employed static calibration to estimate the stress in the sample. This involved applying static loading to the sample with the force F, measured using a reference dynamometer. The stress in the sample is then estimated from the force value using equation
| \[\sigma = \frac{{6F(l + a)}}{{b{h^2}}}.\] | (17) |
We simultaneously recorded readings from the reference dynamometer and the linear displacement gauge (which measured strain under load).
The following values were obtained:
\[\left. \begin{array}{c}{\sigma _A} = 501{A_m} \cdot {10^{ - 6}},{\rm{ Pa}},\\{\sigma _F} = \frac{{6(l + a)}}{{b{h^2}}}F = 0.596 \cdot {10^{ - 6}}F,{\rm{ Pa;}}\\{\rm{for sample}}{\rm{ а}}\\{\sigma _A} = 485{A_m} \cdot {10^{ - 6}},{\rm{ Pa}},\\{\sigma _F} = \frac{{6(l + a)}}{{b{h^2}}}F = 0.444 \cdot {10^{ - 6}}F,{\rm{ Pa}}{\rm{.}}\\{\rm{for sample}}{\rm{ b}}\end{array} \right\}\]
This reveals that stress values estimated from strain and measured by the reference dynamometer differ by no more than 10 %.
To assess this outcome, let us calculate the error of the stress value derived from equation (17). It is the sum of the force measurement error \({\sigma _F} = \frac{{\Delta F}}{F}\) and the sample’s linear dimension error \({\sigma _E} = \frac{{\Delta l + \Delta a}}{{l + a}} + \frac{{\Delta b}}{b}\frac{{z\Delta h}}{h}:\)
| \[\frac{{\Delta \sigma }}{\sigma } = {\delta _F} + {\delta _e}.\] | (18) |
Given that we measured the sample with a precise micrometer Δa = Δl = Δb = Δh = 0.01 mm, and δe = 0.00075 (0.075 %), which is a very low error. The primary contributor to the total error is the force measurement by the reference dynamometer, which is approximately 1 % and corresponds to the instrument’s calibration error.
The stress calculated from strain σA is 8 – 10 % higher than the stress calculated from the force σF for both samples depicted in Fig. 4, a and b. This divergence can be attributed to several factors: the error in Young’s modulus value; the assumptions made when deriving the equations for σA and systematic error overlooked during instrument calibration.
Results and Discussion
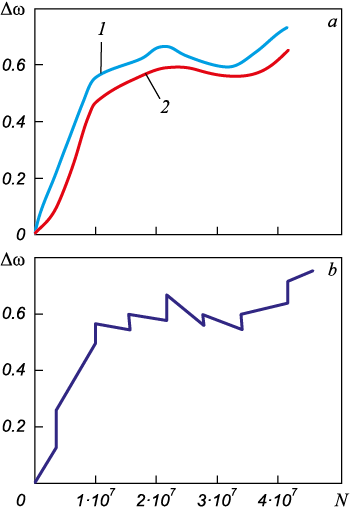
We employed the proposed procedure to conduct a test a sample composed of 03H18K9M5T-EL steel grade (Fig. 4, a). The focal point of our investigation lies in the frequency stability when subjected to loads near the fatigue limit. We scrutinized the frequency characteristics of a sample under 670 MPa load applied at ~200 Hz. Notably, the frequency deviation from the initial value displayed an upward trend denoted by positive values and a downward trend with negative values. The sample underwent a total of 50 million loading cycles. The maximum frequency deviation recorded was 0.75 Hz, making it the most stable frequency among all the samples. Interestingly, a significant frequency shift was observed within the initial 10 million load cycles, amounting to 0.54 Hz. The sample underwent continuous testing, with a load cycle of 10 million cycles per day. The frequency of the sample exhibited changes following overnight interruptions. Specifically, after a 10-hour pause, the morning frequency surpassed the frequency recorded the night before.
In Fig. 5, a, two envelope curves are depicted. Curve (1) portrays the frequency when the testing installation is operational, while Curve (2) represents the frequency once the testing installation is halted after daily operation. Curve 1 delineates the alteration in the initial frequency (“on” frequency), whereas Curve 2 showcases the modification in the final frequency (“off” frequency). The daily fluctuations in frequency during the cyclic testing period fall within the range delineated by the two curves. Another frequency response is illustrated in Fig. 5, b, represented by a discontinuous line. The vertical steps correspond to frequency shifts following overnight interruptions. The sloped lines indicate daily frequency variations as the number of load cycles increases.
Fig. 5. Frequency characteristics during cyclic loading with interruptions in tests: |
Conclusions
We proposed a procedure along with equations to estimate stresses on steel samples of various shapes. This estimation allows us to assess the frequency characteristic alterations during cyclic loading, following the “soft” cantilever bending scheme applied to flat samples with sinusoidal loading. This approach proves to be an effective tool for analyzing the frequency stability and variations in non-continuous fatigue tests. Moreover, it can be employed to gauge material internal friction and energy dissipation, facilitating the determination of damping capacity.
References
1. Shkol’nik L.M. Fatigue Testing Methodology. Guide. Moscow: Metallurgiya; 1978:304. (In Russ.).
2. Gadolina I.V., Makhutov N.A., Erpalov A.V. Varied approaches to loading assessment in fatigue studies. International Journal of Fatigue. 2021;144:106035. https://doi.org/10.1016/j.ijfatigue.2020.106035
3. Suresh S. Fatigue of Metals. Cambridge University Press; 2006:701.
4. Terent’ev V.F., Korableva S.A. Fatigue of Metals. Moscow: Nauka; 2015:479. (In Russ.).
5. Gromov V.E., Ivanov Yu.F., Vorobiev S.V., Konovalov S.V. Fatigue of Steels Modified by High Intensity Electron Beams. Cambridge; 2015:272.
6. Mughrabi H., Christ H.-J. Cyclic deformation and fatigue of selected ferritic and austenitic steels; specific aspects. ISIJ International. 1997;37(12):1154–1169. https://doi.org/10.2355/isijinternational.37.1154
7. Gadenin M.M. Study on damaging and fatigue life of constructions under single- and two-frequency loading modes based on deformational and energy approaches. Inorganic Materials. 2018;54(15):1543–1550. https://doi.org/10.1134/S0020168518150049
8. Gadenin M.M. Influence of loading cycle form on resistance to cyclic deformation and destruction of structural materials. Vestnik nauchno-tekhnicheskogo razvitiya. 2010;(9(37)): 15–19. (In Russ.).
9. Myl’nikov V.V., Shetulov D.I., Kondrashkin O.B., Chernyshov E.A., Pronin A.I. Changes in fatigue resistance of structural steels at different loading spectra. Izvestiya. Ferrous Metallurgy. 2019;62(10):796-802. (In Russ.). https://doi.org/10.17073/0368-0797-2019-10-796-802
10. Gadenin M.M. Calculation-and-experimental estimation of the role of the frequency ratio in changing the endurance at two-frequency deformation modes. Zavodskaya laboratoriya. Diagnostika materialov. 2019;85(1-1):64–71. (In Russ.). https://doi.org/10.26896/1028-6861-2019-85-1-I-64-71
11. Troshchenko V.T., Khamaza L.A., Pokrovsky V.V., etc. Cyclic Deformation and Fatigue of Metals. Bily M. ed. Amsterdam: Elsevier; 1993:500.
12. Golovin S.A., Tikhonova I.V. Temperature dependence of internal friction and properties of deformed low-carbon iron alloys. Deformatsiya i razrushenie materialov. 2013;(7): 16–21. (In Russ.).
13. Golovin S.A., Petrushina A.G. Temperature spectrum of internal friction of cast iron. Izvestiya. Ferrous Metallurgy. 2009;52(9):51–54. (In Russ.).
14. McClaflin D., Fatemi A. Torsional deformation and fatigue of hardened steel including mean stress and stress gradient effects. International Journal of Fatigue. 2004;26(7):773–784. https://doi.org/10.1016/j.ijfatigue.2003.10.019
15. Golovin I.S., Bychkov A.S., Mikhailovskaya A.V., Dobatkin S.V. Contributions of phase and structural transformations in multicomponent Al-Mg alloys to the linear and nonlinear mechanisms of anelasticity. The Physics of Metals and Metallography. 2014;115(2):192–201. https://doi.org/10.1134/S0031918X14020082
16. Kardashev B.K., Sapozhnikov K.V., Betekhtin V.I., Kadomtsev A.G., Narykova M.V. Internal friction, Young’s modulus, and electrical resistivity of submicrocrystalline titanium. Physics of the Solid State. 2017;59(12):2381–2386. https://doi.org/10.1134/S1063783417120204
17. Blanter M.S., Golovin I.S., Neuhäuser H., Sinning H.R. Internal friction in metallic materials. Springer Series in Materials Science. 2007;90:1–535. https://doi.org/10.1007/978-3-540-68758-0
18. Stolyarov V.V. Inelasticity of ultrafine-grained metals. Izvestiya. Ferrous Metallurgy. 2010;53(11):51–54. (In Russ.).
19. Romaniv O.N., Laz’ko L.P., Krys’kiv A.S. Relationship of internal friction to the fatigue life of patented steel wire. Soviet Mater Science. 1984;19:522–527. https://doi.org/10.1007/BF00722120
20. Myl’nikov V.V., Shetulov D.I. Installation for fatigue testing. Patent RF no. 2781466. Bulleten’ izobretenii. 2022;(29). (In Russ.).
21. Demidov A.S., Kashelkin V.V. Determination of damage and stress state of beam samples by changing the natural frequency and amplitude of vibrations. Vestnik Moskovskogo aviatsionnogo instituta. 2009;16(3):62–64. (In Russ.).
About the Authors
V. V. Myl’nikovRussian Federation
Vladimir V. Myl’nikov, Cand. Sci. (Eng.), Assist. Prof. of the Chair “Building Technology”
65 Il’inskaya Str., Nizhny Novgorod 603950, Russian Federation
E. A. Dmitriev
Russian Federation
Eduard A. Dmitriev, Dr. Sci. (Eng.), Assist. Prof., Rector
27 Lenina Ave., Komsomolsk-on-Amur, Khabarovsk Territory 681013, Russian Federation
Review
For citations:
Myl’nikov V.V., Dmitriev E.A. A method for studying the frequency stability of materials during tests for multi-cycle fatigue of steel. Izvestiya. Ferrous Metallurgy. 2023;66(3):367-375. https://doi.org/10.17073/0368-0797-2023-3-367-375


