Scroll to:
Development of a methodology for determining the content of non-metallic inclusions in steel
https://doi.org/10.17073/0368-0797-2024-4-471-480
Abstract
As part of the study, a method was proposed for assessing the metal purity for non-metallic inclusions using optical emission spectrometry. To assess the content of non-metallic inclusions in the slabs, two columns of metal were selected from two slabs of low-alloy metal deoxidized with aluminum. Each column was divided into seven samples in the direction from the small radius of the continuously cast ingot to the large one. We studied these samples to assess metal contamination with non-metallic inclusions using quantitative optical metallography according to ASTM E1245-03, fractional gas analysis (FGA) and optical emission spectral analysis PDA. Analysis of the samples according to ASTM E1245-03 standard showed that in all samples the percentage of oxides and sulfides is on average 10 and 90 %, respectively. According to the results of FGA, it was concluded that such non-metallic oxide inclusions as aluminates predominate in the metal samples of both ingots. A comparison was made between the results of the determination of oxygen in non-metallic inclusions obtained by FGA method and the number of sparks in inclusions at the analysis by PDA method; analysis of the dependencies showed that there are two clearly defined point distributions. To carry out PDA analysis, a program was developed that allows determining the number of inclusions of various types and calculate their volume fraction.
For citations:
Morozov A.O., Komolova O.A., Em A.Yu., Zhemkov A.A., Grigorovich K.V., Yakubenko E.V., Cherkashina T.I., Dagman A.I. Development of a methodology for determining the content of non-metallic inclusions in steel. Izvestiya. Ferrous Metallurgy. 2024;67(4):471-480. https://doi.org/10.17073/0368-0797-2024-4-471-480
Introduction
The quality of steel is significantly influenced by non-metallic inclusions (NMI). The presence of NMI in the finished metal disrupts its homogeneity, degrades surface properties, fatigue strength, and plastic characteristics of the metal [1 – 3]. NMIs act as stress concentrators during deformation, rolling, and stamping of the steel sheet, which subsequently leads to the formation of surface defects [4 – 7]. A negative effect of increased NMI content in molten steel is also the clogging of steel casting nozzles, which drastically reduces casting speed and impairs production efficiency [8].
Various production factors affect the quantity, shape, size, and type of oxide NMIs in steel:
– chemical composition, oxidation state, temperature of the steel and slag;
– chemical and fractional composition of deoxidizers, slag-forming and alloying materials, and their introduction regime;
– inert gas blowing regime of the melt;
– vacuum treatment technology;
– chemical composition of the lining.
Inclusions larger than 50 µm are unevenly distributed and are significantly fewer in number. However, they substantially impact the quality of the finished product, as fatigue failure always occurs in the vicinity of large NMIs regardless of their composition [4; 9 – 11].
Most researchers consider NMIs as initiation sites for hydrogen cracking [12 – 14]. There is a correlation between CaO – Al2O3 , MgO – Al2O3 inclusions and internal and external irregularity defects in the metal [15; 16].
The aim of this study is to compare methods for determining the contamination of metal by NMIs. One of the most common methods for quantitatively assessing NMI content in steel is metallographic analysis – comparing the sizes and shapes of NMIs found in the metal with standard scales using point-counting scales and quantitative optical microscopy as per ASTM E1245-03 standard, determining the volume fraction and size distribution of inclusions [17 – 20].
The fractional gas analysis (FGA) method allows determining the total oxygen content in various types of oxide NMIs and their volume fraction, providing a more comprehensive picture of the various types of NMIs present in the steel [21 – 23].
Assessing metal contamination by NMIs using optical microscopy as per ASTM Е1245-03
The assessment of metal contamination by NMIs using optical microscopy according to ASTM E1245-03 standard was conducted with an optical microscope on a properly prepared polished specimen. Images were captured with a camera. The recognition and identification of inclusions were based on differences in grey level intensity when compared with each other and with the unetched matrix. The measurements and classification of NMIs depended on the nature (oxides, sulfides) of the identified elements in the image. These measurements were performed in each selected field of view. The polished specimen surface needed to be sufficiently large (at least 160 mm2) to measure at least 100 fields of view at the required magnification.
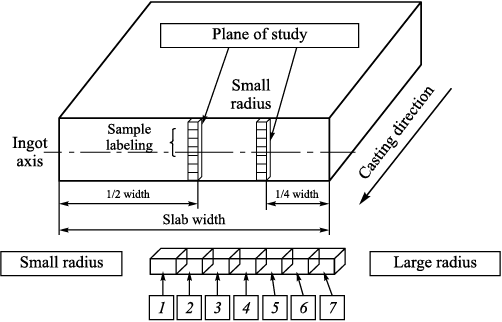
For the study of NMI content, two columns from two continuously cast billets were selected. One column was taken from the middle of the continuously cast billet, and the other from the 1/4 width zone of the ingot. Each column was divided into seven samples. The sampling scheme is shown in Fig. 1. Table 1 presents the sample labeling.
Fig. 1. Sampling scheme
Table 1. Sample labeling
|
Samples 1, 2, 4, 6, and 7 from each column were analyzed. Samples 3 and 5 were not examined.
To prepare samples for evaluating metal contamination by NMIs using optical microscopy as per ASTM E1245-03 standard, metal samples were ground and polished to achieve the required surface quality. The analysis per ASTM E1245-03 standard was conducted on a 200 mm2 surface area for each sample. As a result of the analysis, two main types of NMIs were identified: oxides and sulfides. Oxide-sulfide compounds were also observed as oxysulfides. These oxysulfide inclusions were divided into two parts based on grey shades: oxide and sulfide. Table 2 presents the results of the calculation of the total volume fraction of NMIs and separately the volume fractions of oxide and sulfide inclusions.
Table 2. Total volume fraction of non-metallic inclusions
|
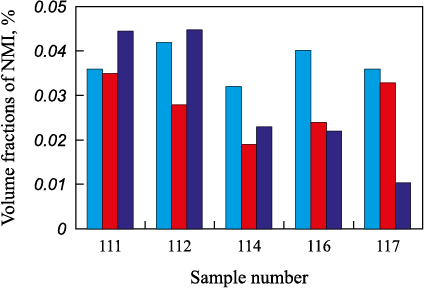
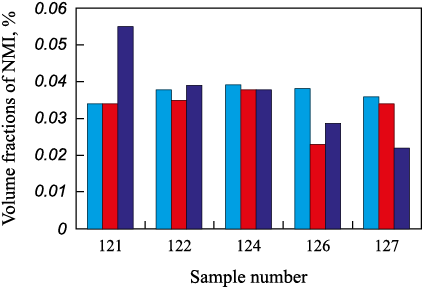
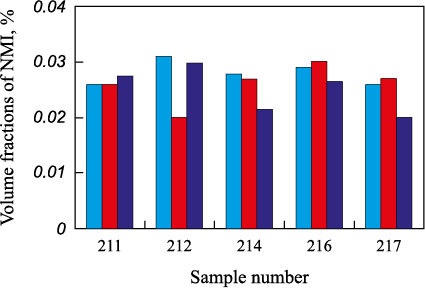
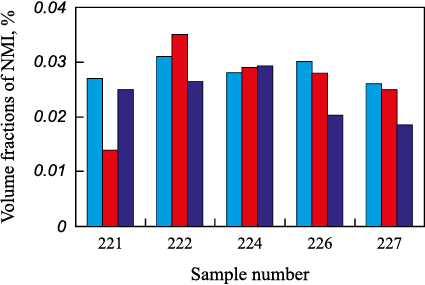
The study results indicated that the average percentage content of oxides and sulfides in the metal across all samples was 10 and 90 %, respectively. However, in samples 111 and 121, the relative oxide content was higher (31 and 17 % sulfides, respectively), indicating uneven distribution of NMIs. Uneven distribution of NMIs was also observed in samples located closer to the small radius (111, 121). The upper zone of the samples showed minimal NMI content, with their size not exceeding 10 µm, and the majority of inclusions located below 1/3 of the sample height. Thus, the upper 1/3 of the samples were cleaner in terms of inclusions than the lower 2/3. Samples (111, 112, 121, 122, 211, 212, 221, 222) closest to the small radius had a higher total volume fraction of NMIs compared to other samples. Figs. 2 – 5 compare the results of total volume fraction calculations of NMIs obtained from the same samples in the laboratories of PJSC “Novolipetsk Metallurgical Plant” (PCL and R&D) and Laboratory No. 17 of IMET RAS.
Fig. 2. Comparison of the results of calculating the volume fractions
Fig. 3. Comparison of the results of calculating the volume fractions
Fig. 4. Comparison of the results of calculating the volume fractions
Fig. 5. Comparison of the results of calculating the volume fractions |
Figs. 2 – 5 show that the metal purity by NMIs in the second slab was slightly higher than in the first slab. The total volume fraction of NMIs in the metal of the second slab did not exceed 0.035 %, whereas in the first slab it varied from 0.020 to 0.055 %. It can be concluded that the second slab was more homogeneous in NMI content throughout its height and contained fewer inclusions than the first slab.
Determining metal contamination by NMIs using fractional gas analysis (FGA)
To determine the content of oxide NMIs formed in the steel, fractional gas analysis (FGA) was conducted on the selected metal samples. The FGA method allows the determination of total oxygen and nitrogen content, the amount of oxygen in various types of oxide NMIs, and the calculation of the volume fraction of different types of oxide NMIs. The main advantage of the FGA method is that it provides rapid information on the total oxygen and nitrogen content in the metal, as well as the oxygen distributed in different types of oxide NMIs.
FGA is a modification of the reduction melting method in a graphite crucible under a stream of carrier gas at a specified linear heating rate of the sample. The analysis method is based on the difference in the temperature dependence of the thermodynamic stability of oxides, which contain the majority of the bound oxygen in the metal. As the melt temperature increases, oxides are reduced by carbon, and oxygen is extracted from the melt as carbon monoxide according to the reaction
Zx Oy (k) + yC(graph.) = x[Z](Fe – C(sat.)) + уСО(g).
The reduction of oxide NMIs contained in the metal is a complex process involving several stages, such as:
– melting of the sample and spreading of the melt over the graphite crucible;
– diffusion of carbon from the graphite crucible into the sample material;
– dissociation and reduction of oxide inclusions by carbon in the melt with the formation of CO molecules and bubbles;
– internal mass transfer of reaction products to the sample surface;
– removal of reaction products from the reaction surface and mass transfer in the gas phase.
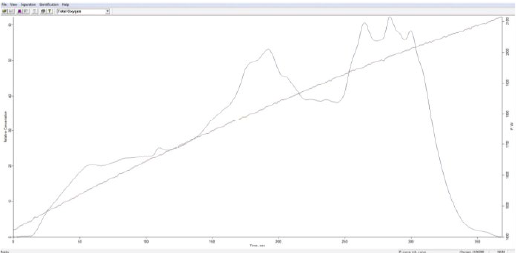
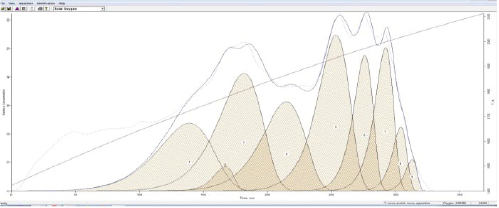
A typical curve of carbon dioxide emission intensity from a metal sample depending on the melt temperature is shown in Fig. 6. The FGA results, processed using the proprietary software “Oxide Separation Pro” are shown in Fig. 7.
Fig. 6. Gas emission curve from the sample (evologram)
Fig. 7. Processing PGA results in Oxide Separation Pro program |
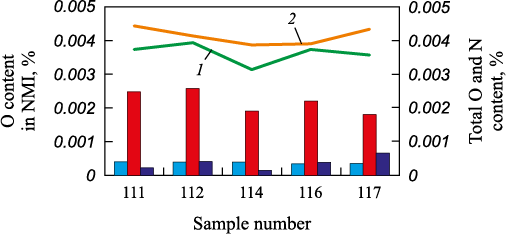
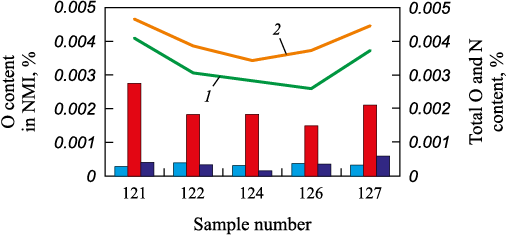
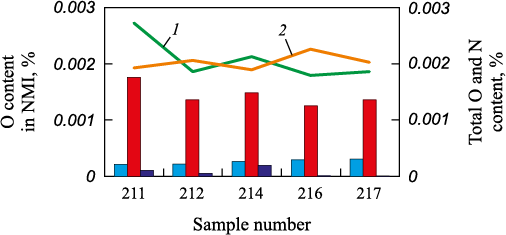
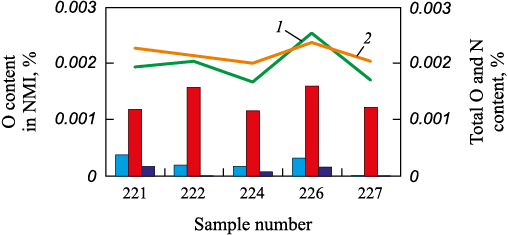
For the FGA studies, three samples weighing 1.0 – 1.5 g were cut from each metal sample. Their surface was cleaned with a file to remove the oxide film and contaminants. After mechanical cleaning, the samples were washed with alcohol and dried. The FGA results are presented in Figs. 8 – 11.
Fig. 8. FGA results of the samples from the central column of ingot 1:
Fig. 9. FGA results of the samples from the outer column (1/4 width) of ingot 1:
Fig. 10. FGA results of the samples from the central column of ingot 2:
Fig. 11. FGA results of the samples from the outer column (1/4 width) of ingot 2: |
The average values and standard deviations (SD) of the results for total oxygen and nitrogen, as well as oxygen in NMIs, for samples from ingots 1 and 2 are presented in Table 3.
Table 3. Average values and SD of total oxygen and nitrogen, oxygen
|
The FGA results indicate that the metal samples from both ingots predominantly contain oxide NMIs such as aluminates (Figs. 8 – 11). Fig. 8 and 9 for ingot 1 show an increasing trend in spinel content from the central part of the columns (samples 114, 124) to the large radius of the ingot (samples 116, 117, 126, 127). In the samples of ingot 2 (Figs. 10, 11), unlike ingot 1, spinel-type inclusions are virtually absent. The average total oxygen content in ingot 1 is 0.0036 % for samples 11X and 0.0033 % for samples 12X. The average nitrogen content is 0.0041 and 0.0040 %, respectively. In ingot 2, the average total oxygen content is 0.0021 % for samples 21X and 0.0020 % for samples 22X. The average nitrogen content is 0.0020 and 0.0022 %, respectively.
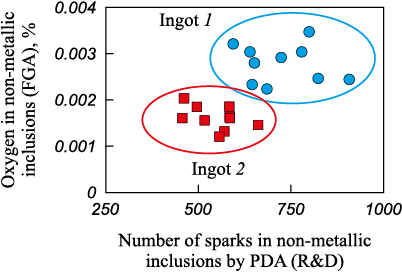
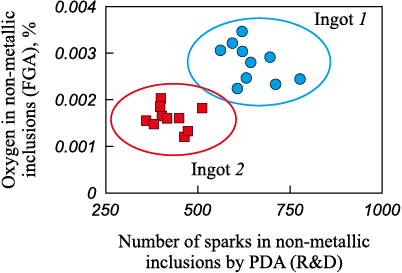
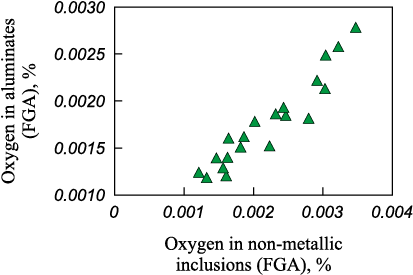
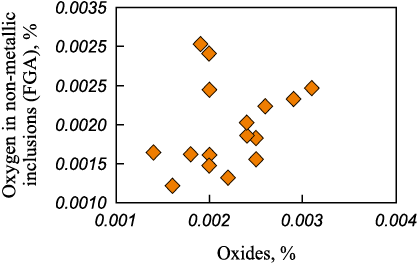
Based on the average oxygen, nitrogen, and oxygen in NMIs, it can be concluded that ingot 2 is cleaner than ingot 1. This corresponds to the results obtained when calculating the volume fractions of inclusions using the metallographic method. Fig. 12 and 13 present correlations between the oxygen content in NMIs obtained by the FGA method in the studied samples and the number of sparks in inclusions during optical-emission spectrometric PDA analysis for identical samples on two different spectrometers (R&D and PCL). Fig. 14 shows the correlation between the total oxygen content in NMIs and the oxygen content in aluminates obtained by the FGA method. Fig. 15 shows the correlation between the oxygen content in NMIs obtained by the FGA method and the oxide content obtained from polished specimens analyzed by optical microscopy according to ASTM E1245-03 standard in Laboratory No. 17.
Fig. 12. Correlation between the oxygen content in non-metallic inclusions
Fig. 13. Correlation between oxygen content in non-metallic inclusions
Fig. 14. Correlation between oxygen content in non-metallic inclusions and amount
Fig. 15. Correlation between oxygen content in non-metallic inclusions |
Fig. 12 and 13 highlight two regions of data points. The first region corresponds to the results from ingot 2, and the second to ingot 1.
A clear correlation is observed between the oxygen content in NMIs and the oxygen content in aluminates obtained by FGA (Fig. 14).
An analysis of the spectral data array of metal samples on spectrometers was conducted. The files display the emission intensities of spectral wavelengths of various elements for each spark (Iэл ).
Based on the results of metal contamination assessment by NMIs according to ASTM E1245-03 standard, a correlation equation was found linking the area of NMIs with Iэл .
Using the obtained equation, the volume fractions of NMIs for the studied samples were calculated.
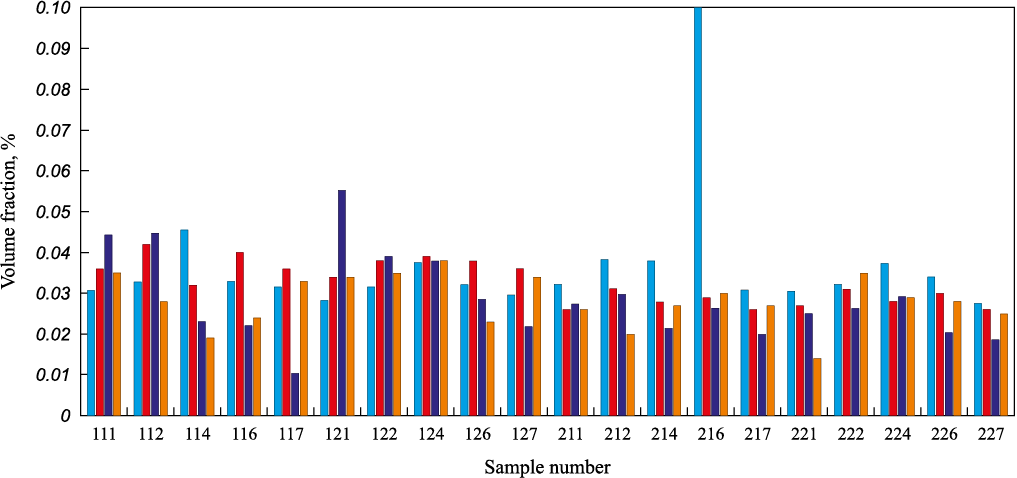
All calculation variants were compared with the results of determining the volume fraction of NMIs using optical microscopy (VD-NMI – total volume fraction of NMIs based on spectral analysis data from two spectrometers at the plant) (Fig. 16).
Fig. 16. Comparison of the results of determining the volume fraction of non-metallic inclusions |
Fig. 16 shows that the results of determining the volume fraction of NMIs in metal samples according to ASTM E1245-03 standard and the PDA method are consistent. The metal sample analyses show significant differences in NMI content in different parts of the slabs.
Conclusions
Studies of samples using quantitative optical metallography methods according to ASTM E1245-03 standard showed that in all samples, the percentage ratio of oxides to sulfides in the total volume fraction averaged 10 and 90 %, respectively. However, in samples 111 and 121, the oxide content was higher at 31 and 17 %, respectively, and these samples also exhibited uneven NMI distribution. In samples located closer to the small radius (111, 121), uneven NMI distribution was also observed. The upper zone of the samples showed minimal NMI content, with their size not exceeding 10 µm, and most inclusions were located below 1/3 of the sample height. Thus, the upper 1/3 of the samples were cleaner in terms of inclusions than the lower 2/3.
Samples (111, 112, 121, 122, 211, 212, 221, 222) closest to the small casting radius had the highest volume fraction of NMIs compared to other samples. The total volume fractions of NMIs in the samples and the separate volume fractions of oxide and sulfide inclusions were determined.
Comparison of the results of volume NMI fraction determination by quantitative optical metallography according to ASTM E1245-03 standard by PCL, R&D, and Laboratory No. 17 staff showed good measurement consistency.
To determine the content of major types of oxide NMIs in different parts of the slabs, fractional gas analysis was conducted on the selected metal samples. The analysis concluded that oxide NMIs, such as aluminates, predominantly occur in the metal samples from both ingots.
For ingot 1, there was an increasing trend in spinel content from the central part of the columns (samples 114, 124) to the large radius of the ingot (samples 116, 117, 126, 127). In the samples from ingot 2, unlike ingot 1, spinel-type inclusions were practically absent. The average total oxygen content in ingot 1 was 0.0036 % for samples 11X and 0.0033 % for samples 12X. The average nitrogen content was 0.0041 and 0.0040 %, respectively. In ingot 2, the average total oxygen content was 0.0021 % for samples 21X and 0.0020 % for samples 22X. The average nitrogen content was 0.0020 and 0.0022 %, respectively. Based on the average results for oxygen, nitrogen, and oxygen in NMIs content data, it can be concluded that ingot 2 is significantly cleaner in terms of oxide NMIs than ingot 1.
A comparison of the results of oxygen in NMIs determined by FGA and the number of spark hits in inclusions during PDA optical-emission spectral analysis (data from PJSC “NLMK” R&D and PCL) was conducted. The analysis showed two distinct distributions of data points. The first distribution corresponds to ingot 2, and the second to ingot 1. The research results also showed a clear correlation between the oxygen content in NMIs and the oxygen content in aluminates obtained by FGA.
An analysis of the spectral data array of selected metal samples, obtained on the workshop spectrometer, was conducted. For the analysis, software was developed to determine the number of inclusions of various types and calculate their volume NMI fractions. The analysis showed good consistency between the results of the PDA optical-emission spectral analysis and the quantitative optical metallography methods according to ASTM E1245-03 standard.
References
1. Xue H.B., Cheng Y.F. Characterization of inclusions of X80 pipeline steel and its correlation with hydrogen-induced cracking. Corrosion Science. 2011;53(4):1201–1208. http://dx.doi.org/10.1016/j.corsci.2010.12.011
2. Huang F., Liu J., Deng Z.Y., Cheng J.H., Lu Z.H., Li X.G. Effect of microstructure and inclusions on hydrogen induced cracking susceptibility and hydrogen trapping efficiency of X120 pipeline steel. Materials Science and Engineering. 2010;527(26):6997–7001. http://dx.doi.org/10.1016/j.msea.2010.07.022
3. Kim W.K., Koh S.U., Yang B.Y., Kim K.Y. Effect of environmental and metallurgical factors on hydrogen induced cracking of HSLA steels. Corrosion Science. 2008;50(12): 3336–3342. https://doi.org/10.1016%2Fj.corsci.2008.09.030
4. Bate P.S. Texture development in the cold rolling of IF steel. Materials Science and Engineering: A. 2004;380(1–2): 365–377. https://doi.org/10.1016/j.msea.2004.04.007
5. Ma J., Zhang B., Xu D., Han E., Ke W. Effects of inclusion and loading direction on the fatigue behavior of hot rolled low carbon steel. International Journal of Fatigue. 2010;32(7): 1116–1125. http://dx.doi.org/10.1016/j.ijfatigue.2009.12.005
6. Ikäheimonen J., Leiviskä K., Ruuska J., Matkala J. Nozzle clogging prediction in continuous casting of steel. In: 15th Triennial World Congress, July 21–26 Barcelona, Spain. 2002:143–147.
7. Tehovnik F., Burja J., Arh B., Knap M. Submerged entry nozzle clogging during continuous casting of al-killed steel. Metalurgija. 2015;54(2):371–374.
8. Shchukina L.I., Tuvaev V.F., Komolova O.A., Grigorovich K.V. Investigation of the causes of reduced pourability of sheet steel аt domestic enterprises. In: Proceedings of XV Int. Congress of Steelmakers. 2018:357–362. (In Russ.).
9. Xiaolei Z., Zhe S., Guifang Z. The evolution of non-metallic inclusions in IF steel. Applied Mechanics and Materials. 2015;696:62–65. http://dx.doi.org/10.4028/www.scientific.net/AMM.696.62
10. Zaitsev A.I., Rodionova I.G., Khoroshilov A.D., Mezin F.I., Semernin G.V., Mishnev P.A., Zhironkin M.V., Bikin K.B. Analysis of surface defects occurrence in cold-rolled products from IF-steels. Elektrometallurgiya. 2012;(7):36–40. (In Russ.).
11. Shiozawa K., Lu L. Effect of non-metallic inclusion size and residual stresses on gigacycle fatigue properties in high strength steel. Advanced Materials Research. 2008; 44–46:33–42. https://doi.org/10.4028/www.scientific.net/AMR.44-46.33
12. Liu Z.Y., Li X. G., Du C. W., Lu L., Zhang Y. R., Cheng Y.F. Effect of inclusions on initiation of stress corrosion cracks in X70 pipeline steel in an acidic soil environment. Corrosion Science. 2009;51(4):895–900. https://doi.org/10.1016/j.corsci.2009.01.007
13. Maiti R., Hawbolt E.B. The effect of inclusion parameters on the fracture toughness of two X-70 Pipeline steels. Journal of Materials for Energy Systems. 1985;6(4):242–250. https://doi.org/10.1007/BF02833513
14. Dong C.F., Liu Z.Y., Li X.G., Cheng Y.F. Effects of hydrogen-charging on the susceptibility of X100 pipeline steel to hydrogen-induced cracking. International Journal of Hydrogen Energy. 2009;34(24):9879–9884. https://doi.org/10.1016/j.ijhydene.2009.09.090
15. Li B.S., Zhu H.Y., Xue Z.L., Qin Z.F., Sun J. Analysis of inner fold and bulge defects on J55 steel for oil casing pipe. AIP Advances. 2019;9:085109. http://dx.doi.org/10.1063/1.5100889
16. Zhu H.Y., Wang L.Q., Li J.L., Zhao J.X., Yu Y. Effects of metallurgical factors on reticular crack formations in Nb-bearing pipeline steel. High Temperature Materials and Processes. 2020;39(1):81–87. http://dx.doi.org/10.1515/htmp-2020-0043
17. Vander-Voort G.F. Materials Characterization. “Image Analysis”: Metals Handbook. ASM, Metals Park, OH; 1986;10(9):309–322
18. Karasev A.V., Suito H. Analysis of size distributions of primary oxide inclusions in Fe-10 mass pct Ni-M (M = Si, Ti, Al, Zr, and Ce) alloy. Metallurgical and Materials Transactions B. 1999;30(2):259–270. https://doi.org/10.1007/s11663-999-0055-0
19. Ohta H., Suito H. Characteristics of particle size distribution of deoxidation products with Mg, Zr, Al, Ca, Si/Mn and Mg/Al in Fe10 mass % Ni alloy. ISIJ International. 2006;46(1):14–21. http://dx.doi.org/10.2355/isijinternational.46.14
20. Kanbe Y., Karasev A., Todoroki H., Jönsson P.G. Application of extreme value analysis for two- and three-dimensional determinations of the largest inclusion in metal samples. ISIJ International. 2011;51(4):593–602. http://dx.doi.org/10.2355/isijinternational.51.593
21. Pande M.M., Guo M. Determination of steel cleanliness in ultra-low carbon steel by pulse discrimination analysis optical emission spectroscopy technique. ISIJ International. 2011;51(11):1778–1787. http://dx.doi.org/10.2355/isijinternational.51.1778
22. Gorkusha D.V., Grigorovich K.V., Karasev A.V., Komolova O.A. Content modification of different types of nonmetallic inclusions during low-carbon IF steel ladle treatment. Izvestiya. Ferrous Metallurgy. 2019;62(5):345–352.(In Russ.). http://dx.doi.org/10.17073/0368-0797-2019-5-345-352
23. Komolova O.A., Grigorovich K.V. Mathematical models, algorithms and software for dynamic simulation of ladle treatment technology. Metallurgia Italiana. 2019;111(3):20–24.
About the Authors
A. O. MorozovRussian Federation
Anton O. Morozov, Junior Researcher of the Laboratory of Materials Diagnostics
49 Leninskii Ave., Moscow 119991, Russian Federation
O. A. Komolova
Russian Federation
Ol’ga A. Komolova, Cand. Sci. (Eng.), Senior Researcher of the Laboratory of Materials Diagnostics
49 Leninskii Ave., Moscow 119991, Russian Federation
A. Yu. Em
Russian Federation
Anton Yu. Em, Junior Researcher of the Laboratory of Materials Diagnostics
49 Leninskii Ave., Moscow 119991, Russian Federation
A. A. Zhemkov
Russian Federation
Anton A. Zhemkov, Junior Researcher of the Laboratory of Materials Diagnostics
49 Leninskii Ave., Moscow 119991, Russian Federation
K. V. Grigorovich
Russian Federation
Konstantin V. Grigorovich, Academician, Dr. Sci. (Eng.), Head of the Laboratory of Materials Diagnostics
49 Leninskii Ave., Moscow 119991, Russian Federation
E. V. Yakubenko
Russian Federation
Elena V. Yakubenko, Head of the Department
2 Metallurgov Sqr., Lipetsk 398040, Russian Federation
T. I. Cherkashina
Russian Federation
Tat’yana I. Cherkashina, Head of the Laboratory
2 Metallurgov Sqr., Lipetsk 398040, Russian Federation
A. I. Dagman
Russian Federation
Aleksei I. Dagman, Cand. Sci. (Eng.), Head of the Expert Direction of the Directorate of Development of New Process Technologies
2 Metallurgov Sqr., Lipetsk 398040, Russian Federation
Review
For citations:
Morozov A.O., Komolova O.A., Em A.Yu., Zhemkov A.A., Grigorovich K.V., Yakubenko E.V., Cherkashina T.I., Dagman A.I. Development of a methodology for determining the content of non-metallic inclusions in steel. Izvestiya. Ferrous Metallurgy. 2024;67(4):471-480. https://doi.org/10.17073/0368-0797-2024-4-471-480


