Scroll to:
Parameters of substructure in wrought Cu – Mn alloys with FCC lattice
https://doi.org/10.17073/0368-0797-2023-1-62-69
Abstract
The development and success of the physical science of strength and plasticity allow the main aspects of dislocation physics to be proposed. This work considers the current state of this issue as part of a multilevel approach: patterns of dislocation accumulation in a material after deformation with various degrees. The main mechanism of hardening of a metal polycrystal is the accumulation of dislocations in its grains, while the main hardening parameter is the mean scalar density of dislocations. The scalar density of dislocations is divided into the following components: the density of statistically stored (ρS ); and the density of geometrically necessary (ρG ) dislocations. The transmission diffraction electron microscopy (TEM) is used to study the stages of dislocation substructure (DSS) types development in Cu – Mn alloys depending on the concentration of an alloying element during active plastic deformation. Polycrystal alloys are studied in a wide concentration range: from 0.4 to 25 % Mn (at.). A number of dislocation substructure parameters are measured using electron microscope images: mean scalar density of dislocations <ρ>; density of statistically stored (ρS ) and geometrically necessary (ρG ) dislocations; curvature-torsion of the crystal lattice (χ); density of microstrips (Pstrip ); and density of broken sub-boundaries (Mbr. bnd. ). A sequence of transformations of the DSS types with an increase in the deformation degree and amount of the second element to form the substructure type and parameters was established. The influence of the second element and grain size on the mean scalar density of dislocations and its components was experimentally determined. The presence of disorientations in the substructure during deformation is based on the measurement of these parameters using the TEM.
Keywords
For citations:
Trishkina L.I., Klopotov A.A., Potekaev A.I., Cherkasova T.V., Borodin V.I. Parameters of substructure in wrought Cu – Mn alloys with FCC lattice. Izvestiya. Ferrous Metallurgy. 2023;66(1):62-69. https://doi.org/10.17073/0368-0797-2023-1-62-69
Introduction
Variation in the composition of alloys of Cu – Mn system can change the degree of short-range order and the resistance to motion of dislocations [1, 2]. At the same time, in the alloys of this system, the value of the stacking-fault energy (SFE) slightly depends on the concentration of the alloying element – manganese [3]. Variation in the concentration of the second element in the solid solution can lead to a change in the dislocation start stress and friction forces and, consequently, to a change in the resistance to the beginning of plastic deformation. An increase in the deformation degree leads to formation of a certain type of dislocation substructure, which, in turn, determines the deformation hardening of polycrystals. The nature and type of the dislocation structures formed are closely connected with the SFE value, local order parameters, and friction forces between dislocations. These parameters can significantly vary depending on the concentration of the alloying element, degree of ordering in solid solutions, as well as deformation degree [4 – 6].
For many years, the dislocation structure was characterized mainly by such a parameter as the mean scalar density of dislocations <ρ>. Further development of the dislocation study has led to the division of <ρ> into the following components which have different physical meanings: geometrically necessary (ρG ) and statisticallystored (ρS ) dislocations. The references show thatthe geometrically necessary dislocations are formedin the case of deformations in the polycrystal metals and alloys with deformation twins, in the dispersion-hardened materials and in other cases of functioning of strong barriers to dislocation sliding [7 – 9].
Density ρG is directly connected with the curvature-torsion of the crystal lattice χ [13, 14]:
\[{\rho _G} = \frac{1}{b}\frac{{\partial \varphi }}{{\partial \ell }} = \frac{\chi }{b} = {(rb)^{ - 1}},\]
where b is the Burgers vector; φ is the tilting angle of the crystal plane; ℓ is the distance on the plane; \(\chi = \large\frac{{\partial \varphi}}{{\partial \ell}}\) is the curvature-torsion of the crystal lattice; r is the radius of crystal curvature.
The formation of dislocations and dislocation reactions in the alloys after plastic deformation can be considered to be random processes. The dislocations subjected to deceleration by others formed in the course of plastic deformation are called statistically stored dislocations (SSD) [11]. Such statistically stored dislocations are formed at the very beginning of plastic deformation and are decelerated mainly by weak barriers consisting of other dislocations. When the stronger barriers (such as particles of second phases, deformation twins, or grain boundaries) are present in the alloys, the geometrically necessary dislocations (GND) accumulate in the material, and plastic deformation gradients (1) are available [11]. As a result, the mean scalar density of dislocations is determined by the following equation
<ρ> = ρS + ρG .
This work studies the influence of manganese alloying and grain size in wrought Cu – Mn alloys with FCC lattice using the transmission electron microscopy.
Study materials and methods
The study materials are polycrystal alloys of Cu – Mn system in the manganese concentration range from 0.4 to 25 % (henceforward, atomic (at.) percentage). Alloys with the mean grain size of 10, 20, 40, 60, 100, 120 and 240 µm were studied. Samples of the alloys studied were deformed by elongation at the room temperature with a rate of 2·10–2 s–1. The dislocation structure was studied by menans of transmission diffraction electron microscopy (TEM) using goniometer-equipped electron microscopes with accelerating voltage of 125 kV. The foils were examined in the microscope column at a 30,000-power magnification. The technique for measuring the dislocation structure parameters is given in [12, 13].
Results and discussion
We considered formation of the dislocation substructure (DSS) depending on the concentration of the alloying element at small (εtr = 0.05) deformation degrees in the copper-manganese alloys. For easy comparison of the substructures, the study results are provided for one grain size equal to 100 µm.
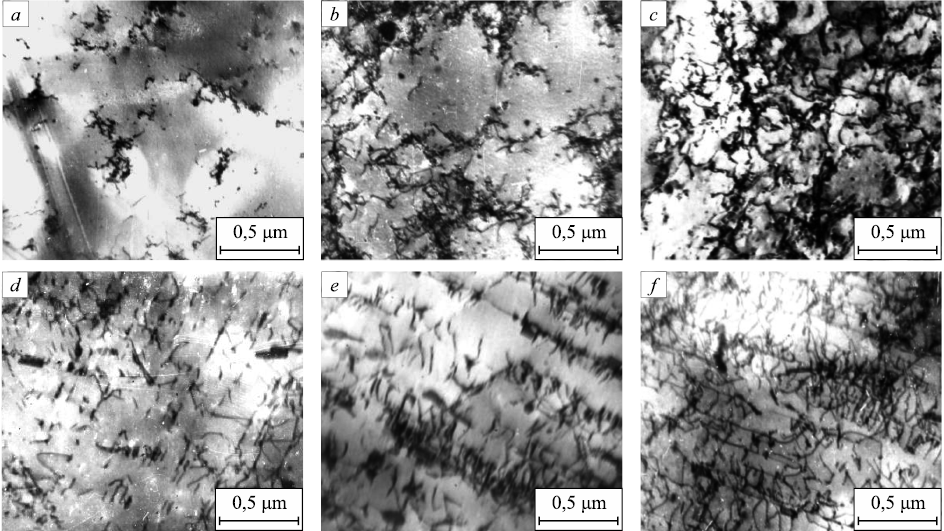
Fig. 1 shows the types of the dislocation substructures formed with growth of the second element. Analysis of the electron microscope images allowed us to find the following regularities in the DSS formations. With the moderate deformation degrees (εtr = 0.05 – 0.10) in the alloys studied (Cu + 0.4 % Mn, Cu + 8 % Mn and Cu + 19 % Mn), tangles (Fig. 1, a) as well as cell substructures without disorientations (Fig. 1, b) are formed from the dislocations. The increase in the concentration of the second component up to 8 % Mn results in transition from the cell DSS to the cell-mesh DSS (Fig. 1, c). The further growth of the second element concentration is accompanied by the formation of the new DSS type. In alloys Cu + 13 % Mn, Cu + 19 % Mn and Cu + 25 % Mn, we can observe the following sequence of the DSS types formation: dislocation chaos (Fig. 1, d); dislocation clusters and dislocation loops (Fig. 1, e); mesh DSS (Fig. 1, f ) respectively.
Fig. 1. Electron microscope images of DSS types formed at εtr = 0.05 ÷ 0.10 |
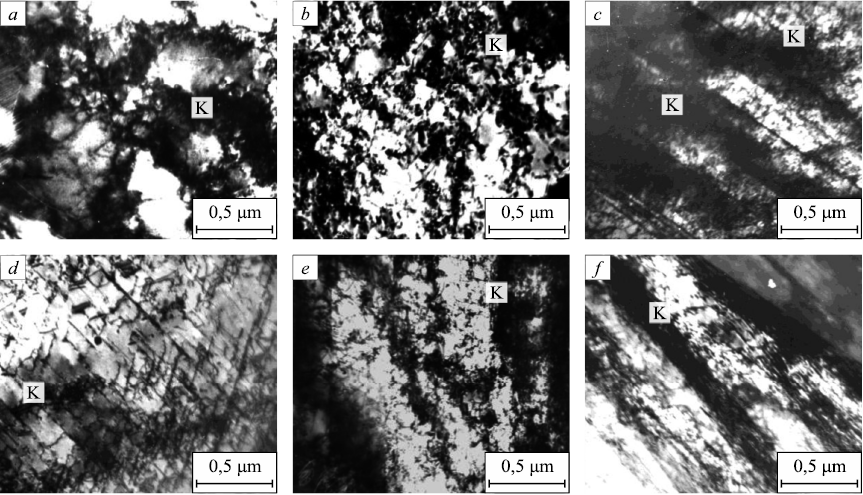
We considered the influence of the deformation degree growth in the alloys studied, resulting in disorientations appeared in the DSS. The electron microscope images show this process as the appearance of the extinction deformation contours (Fig. 2).
Fig. 2. Electron microscope images of DSS types formed at εtr > 0.20 in Cu + 0.4 % Mn alloys |
In Cu – Mn alloys with a low concentration of the alloying element (up to 6 %), the disoriented cell substructure is formed with the deformation degree of 0.20 (Fig. 2, a). In alloys with a concentration of the alloying element higher than 8 % Mn, the disoriented cell-mesh substructure develops with further deformation increase (Fig. 2, b). With such deformation, clumps are formed from dislocations (Fig. 2, b) which riginate on the long rectilinear dislocations formed even at low deformation degrees. As a result, an increase in the density of clumps is observed, and the structure tends to become more homogeneous.
Fig. 2 provides electron microscope images of the DSS types formed with the higher deformation degrees (εtr > 0.20) in the alloys with different concentrations of the alloying element. The experiments established that, in the alloys with concentration of the second element equal to 0.4, 2.4 and 6 % Mn, the following substructures are observed: disoriented cell, cell-mesh, and microstrip DSS. The examples of the substructure types observed for alloy Cu + 0.4 % Mn are provided in Fig. 2, a and b. In alloy Cu + 6 % Mn, the formation of the microstrip DSS is observed inside the grain, appearing along boundaries of the disoriented cells or from the grain boundaries (Fig. 2, c). It is important to note that the kinetics of the microstrip substructure formation and volume fraction growth is often connected with growth through the alloy of the broken boundaries.
It was established that, in alloys with the higher concentration of the alloying element (8, 10, 13, 19 and 25 % Mn), such substructures as disoriented mesh, disoriented cell-mesh, and microstrip DSS are present The example of the substructures observed at εtr > 0.20 is shown in Fig. 2, d – f for alloy Cu + 19 % Mn. Based on the analysis of the electron microscope photos, it was established that the alloy with 8 % Mn is the boundarywhen transferring from the classically cell DSS to cell-mesh DSS.
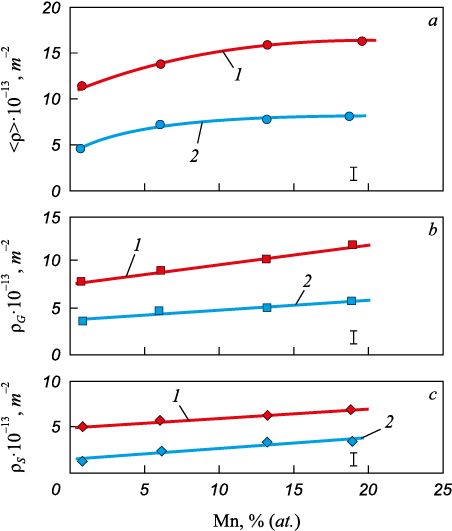
The photographs were used to measure the mean scalar density of dislocations <ρ>, the density of statistically stored (ρS ) and geometrically necessary (ρG ) dislocations, the curvature-torsion of the crystalline lattice χ, the density of microstrips Pstrip , as well as the density of broken boundaries Mbr.bndwith different grain sizes <d>. The dependencies of the mean scalar density of dislocations, density of geometrically necessary and statistically stored dislocations on the concentration of alloying element CMn at εtr = 0.30 and grain sizes 10 and 240 μm are provided in Fig. 3.
Fig. 3. Dependencies of the mean scalar density of dislocations <ρ> (а), |
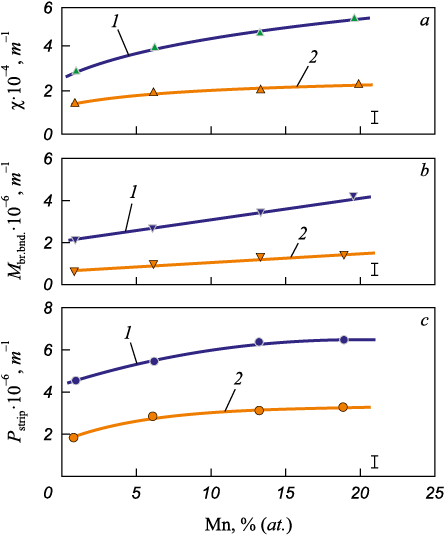
The growth of manganese concentration results in increase of both mean scalar density of dislocations <ρ> and its components ρG and ρS . The growth of deformation degree results in formation of disorientations in the substructure. Fig. 4 shows dependencies of the parameters which characterized is orientations in Cu – Mn alloys: the curvature-torsion of the crystal lattice, the density of microstrips, and the density of broken sub-boundaries. The values of χ, Pstrip , and Mbr. bnd. increase with the increase of the concentration of the alloying element CMn more significantly in the alloys with the grain size of 10 µm compared to the alloys with the grain size of 240 µm.
Fig. 4. Dependences of DSS curvature-torsion of crystal lattice χ (а), |
We considered the features of the atomic volume change in solid solutions in the alloys of Cu – Mn system. It is believed that, in the range of existence of solid solutions of two elements, the change in the lattice period depending on the composition should be linear. This assumption was represented as the Vegard’s law [14 – 16]. According to this law, the lattice period of the solid solution of two components with the same or similar structure and periods a1 and a2 should change linearly depending on the concentration of these components x1 and x2 expressed in atomic fractions:
а = x1 a1 + x2 a2 .
On the other hand, Zen proposed the atomic volume additivity rule for ideal solid solutions [15–17]:
Ω = СА ΩА + СВ ΩВ ,
where СА and СВ , ΩА и ΩВ are the concentrations and atomic volumes of the pure components.
A volume fraction of the elementary cell per one atom is understood as the atomic volume, that is:
| \[\Omega = \frac{V}{n},\] | (1) |
where n is the number of atoms in the elementary cell.
Atomic volumes of pure metals Ω calculated in this way depend least of all on the crystal lattice type. The atomic volume of pure metals Ω is the more universal characteristic with respect to the parameters of elementary cell parameters pure metals and can be used to analyze the properties of compounds formed by elements with different crystal structures. This approach was successfully applied in [14] during analysis of Ti-Ni-based binary compounds.
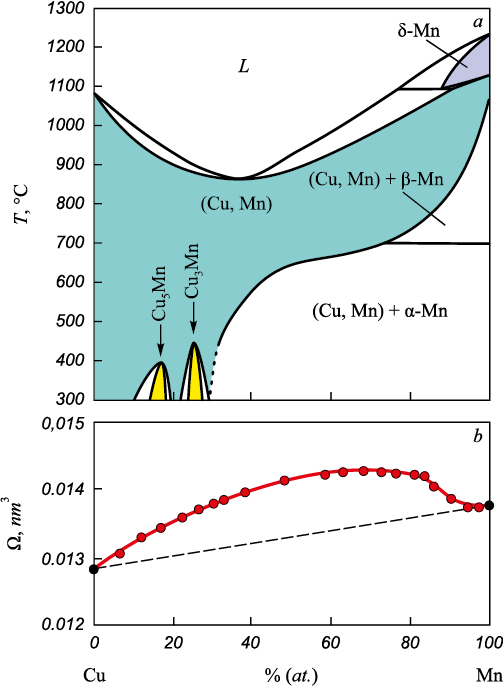
Zen’s law is true just as rare as Vegard’s rule; however, it is very popular. There are many models for predicting deviations from the Zen’s law, but the reliability level of these predictions is low. None of the models predicts even a deviation sign with an accuracy of more than 60 %. This suggests that the main factors of the deviation from Zen’s law have not yet been identified.
For the most of the known alloys where solid solutions are formed, the negative deviation of the atomic volume from Zen’s rule is observed [18, 17]:
| \[\Delta \Omega = \Omega _\Gamma ^{{\rm{экс}}} - \Omega _i^{{\rm{теор}}} < 0.\] | (2) |
Fig. 5, a shows a phase diagram of Cu – Mn system with two concentration areas where ordered phases are formed as a result of “disorder – order” phase transitions of compositions Cu5Mn and Cu3Mn, as well as concentration dependencies of atomic volumes of the alloys of system Cu – Mn (Fig. 5, b). Within the alloys of this system, the positive deviation of the atomic volume from the Zen’s law is observed. Such deviation from the Zen’s law on the concentration dependency of the atomic volume occurs much less frequently than the negative deviation [20].
Fig. 5. Phase diagram (a) and atomic volume |
The above data indicates a change in the forces of interatomic interaction during formation of solid solutions in Cu – Mn system (according to equation connecting the crystal energy and atomic volume Ω in the case of metal nature of atomic interaction [21]):
\[U = \frac{{A{e^2}}}{{{\Omega ^{1/3}}}} + \frac{B}{{{\Omega ^{2/3}}}} + \frac{{C{e^2}}}{\Omega };\]
where \(\large\frac{{A{e^2}}}{{{\Omega ^{1/3}}}}\) and \(\large\frac{B}{{{\Omega ^{2/3}}}}\) are the potential and kinetic energies of free electrons; \(\large\frac{{C{e^2}}}{\Omega }\) characterizes the kinetic energy of electrons which occupy the lower energy states.
It is known that Peierls stress EP , which is the minimum required stress for dislocation displacementin crystal bodies, depends on the interplane distance d. In this case, maximum EP , that is the Peierls barrier value is determined as follows [22]
\[{\tau _P} = \frac{G}{{1 - \nu}}\exp \left( { - \frac{{2\pi{\omega _{\rm{d}}}}}{b}}\right),\]
where \({\omega _{\rm{d}}} = \large\frac{d}{{1 - \nu}}\) is the dislocation width; d is the interplane distance; G is the shear modulus; ν is the Poisson’s ration; b is the Burgers vector.
Thus, the dependence of the atomic volume on the concentration for the alloys of Cu – Mn system allows us to state, according to the above analysis based on equations (1) and (2), that the increase in atomic volume contributes to the crystal energy change and the Peierls barrier height. Such changes in the atomic volume exercise significant influence over mobility of the statistically stored and geometrically necessary dislocations.
Conclusions
Based on the electron microscope study of the fine structure of wrought samples of the alloys of Cu – Mn system with FCC lattice, the parameters of the dislocation substructures are determined (mean scalar density of dislocations <ρ> and its components: density of statistically stored ρS and geometrically necessary ρG dislocations; curvature-torsion of crystal lattice χ, density of microstrips Pstrip and density of broken sub-boundaries Mbr. bnd. ) depending on the concentration of alloying element (manganese) with different grain sizes. Features of evolution of the dislocation substructures in alloys with different manganese content are determined; and it is established that the alloy with 8 % Mn is the boundary when transferring from the classically cell DSS to cell-mesh DSS.
It was shown that the grain size decrease results in dislocation structure parameters increase. This is due to the fact that dislocation accumulation in the grains of smaller size is connected with their lower mobility.
Based on the analysis of concentration dependences of the atomic volumes in the alloys of Cu – Mn system, the positive deviation from Zen’s law was established. Such an increase in atomic volume with the alloying element concentration growth contributes to the crystal energy change and, as a result, to the Peierls barrier increase. This xercises significant influence over mobility of the statistically stored and geometrically necessary dislocations. This data correlates with the results of electron microscope studies: in Cu – Mn alloys with the higher manganese content, the dislocation substructure parameters growth is observed.
It was also established that the grain size decrease has more significant effect on the dislocation substructure parameters than does the content of alloying element atoms in the alloys of Cu – Mn system with FCC lattice.
References
1. Dudarev E.F., Kornienko A.L., Bakach G.P. Influence of energy of packaging defect on development of dislocation structure, deformation hardening and plasticity of the HCC of solid materials. Izvestiya vuzov. Fizika. 1991; 34(3): 35–46. (In Russ.).
2. Panin V.E., Dudarev E.F., Bushnev L.S. Structure and Mechanical Properties of Solid Substitution Solutions. Moscow: Metallurgiya; 1971: 204. (In Russ.).
3. Koneva N.A., Trishkina L.I., Cherkasova T.V. Effect of stacking-fault energy on the accumulation of dislocations during plastic deformation of copper-based polycrystalline alloys. Letters on Materials. 2017; 7(3): 282–286. https://doi.org/10.22226/2410-3535-2017-3-282-286
4. Koneva N.A., Kozlov E.V., Trishkina L.I., Cherkasova T.V. Evolution of dislocation structure during deformation of polycrystalline copper-based alloys and their plasticity. Fundamental’nye problemy sovremennogo materialovedeniya. 2016; 13(2): 162–167. (In Russ.).
5. Koneva N.A., Kozlov E.V. Physical nature of stages of plastic deformation. In: Structural Levels of Plastic Deformation and Destruction. Panin V.E. ed. Novosibirsk: Nauka; 1990: 123–186. (In Russ.).
6. Foley D.L., Latypov M.I., Zhao X., Hestroffer J., Beyerlein I.J., Lamberson L.E., Taheri M.L. Geometrically necessary dislocation density evolution as a function of microstructure and strain rate. Materials Science and Engineering: A. 2022; 831; 142224. https://doi.org/10.1016/j.msea.2021.142224
7. Hansen L.T., Fullwood D.T., Homer E.R., Wagoner R.H., Lim H., Carroll J.D., Zhou G., Bong H.J. An investigation of geometrically necessary dislocations and back stress in large grained tantalum via EBSD and CPFEM. Materials Science and Engineering: A. 2020; 772: 138704. https://doi.org/10.1016/j.msea.2019.138704
8. Dahlberg C.F.O., Saito Y., Öztop M.S., Kysar J.W. Geometrically necessary dislocation density measurements at a grain boundary due to wedge indentation into an aluminum bicrystal. Journal of the Mechanics and Physics of Solids. 2017; 105: 131–149. https://doi.org/10.1016/j.jmps.2017.05.005
9. Lin P., Nie J., Liu Z., Zhuang Z. Study of two hardening mechanism caused by geometrically necessary dislocations in thin films with passivation layer. International Journal of Solids and Structures. 2019; 160: 59–67. https://doi.org/10.1016/j.ijsolstr.2018.10.015
10. Ashby M.F. The deformation of plastically non-homogeneous materials. Philosophical Magazine. A Journal of Theoretical Experimental and Applied. 1970; 21(170): 399–424. https://doi.org/10.1080/14786437008238426
11. Ashby M.F. Strengthening Methods in Crystals. Kelly A., Nicholson R.B. eds. London: Applied Science Publishers LTD; 1971: 137–192.
12. Saltykov S.A. Stereometric Metallography. Moscow: Metallurgiya; 1970: 376. (In Russ.).
13. Trishkina L.I., Cherkasova T.V., Popova N.A., etc. Dislocation Ensemble: Scalar Dislocation Density and its Components. Tomsk: Tomsk State University of Architecture and Building; 2019: 120. (In Russ.).
14. Potekaev A.I., Klopotov A.A., Kozlov E.V., etc. Weakly Stable Pre-Transition Structures in Titanium Nickelide. Tomsk: NTL; 2004, 296 p. (In Russ.).
15. Pearson W.B. The Crystal Chemistry and Physics of Metals and Alloys. New York: Wiley; 1972: 806.
16. Kozlov E.V., Dement’ev V.M., Kormin N.M., Shtern D.M. Structures and Stability of Ordered Phases. Tomsk: TSU; 1994, 247 p. (In Russ.).
17. Zen E.-an. Validity of “Vegard’s Law”. American Mineralogist. 1956; 41(5-6): 523–524.
18. Massalski Т.В. Binary Alloy Phase Diagrams. American Society for Metals: Metals Park, Ohio; 1986, 1987; Vols. 1, 2: 2224.
19. Barabash O.M., Koval’ Yu.N. Structure and Properties of Metals and Alloys. Crystal Structure of Metals and Alloys. Reference book. Kiev: Naukova dumka; 1986: 600. (In Russ.).
20. Landa A., Klepeis J.E., Rudd R.E., Caspersen K.J., Young D.A. Analytic binary alloy volume-concentration relations and the deviation from Zen’s law. Applied Sciences. 2021; 11(13): 6231. https://doi.org/10.3390/app11136231
21. Magelung O. Festkörpertheorie III: Lokalisierte Zustände. Berlin etc., 1973. (In Germ.).
22. Fistul’ V.I. Physics and Chemistry of Solid State. Vol. 1. Moscow: Metallurgiya; 1995: 480. (In Russ.).
About the Authors
L. I. TrishkinaRussian Federation
Lyudmila I. Trishkina, Dr. Sci. (Phys.-Math.), Prof. of the Chair of Physics, Chemistry, and Theoretical Mechanics
2 Solyanaya Sqr., Tomsk 634003, Russian Federation
A. A. Klopotov
Russian Federation
Anatolii A. Klopotov, Dr. Sci. (Phys.-Math.), Prof. of the Chair of Applied Mechanics and Materials Science
2 Solyanaya Sqr., Tomsk 634003, Russian Federation
A. I. Potekaev
Russian Federation
Aleksandr I. Potekaev, Dr. Sci. (Phys.-Math.), Prof. of the Chair of General and Experimental Physics
36 Lenina Ave., Тomsk 634050, Russian Federation
T. V. Cherkasova
Russian Federation
Tat’yana V. Cherkasova, Cand. Sci. (Phys.-Math.), Assist. Prof. of the Chair of Physics, Chemistry, and Theoretical Mechanics
2 Solyanaya Sqr., Tomsk 634003, Russian Federation
V. I. Borodin
Russian Federation
Vladislav I. Borodin, General Director
9 Frunze Ave., Tomsk 634029, Russian Federation
Review
For citations:
Trishkina L.I., Klopotov A.A., Potekaev A.I., Cherkasova T.V., Borodin V.I. Parameters of substructure in wrought Cu – Mn alloys with FCC lattice. Izvestiya. Ferrous Metallurgy. 2023;66(1):62-69. https://doi.org/10.17073/0368-0797-2023-1-62-69


